3 posts tagged with "JMeter"

View All Tags

· 4 min read

As technology continues to advance, organizations are becoming increasingly reliant on computer systems to support their operations. To ensure that these systems are performing optimally, it is essential to measure their performance. A good performance test report will contain many metrics, but they can be a bit difficult to understand for non-professional performance testers. That’s when the APDEX (Application Performance Index) metric can become very useful as it is a simple and easy-to-understand metric that helps organizations understand how well their systems are performing and identify areas for improvement. In this blog post, we will explore what the APDEX metric is, how it works, and its advantages and disadvantages.

What is the APDEX Metric?

The APDEX metric is a standardized way of measuring the performance of computer systems. It is based on the response time of a system, which is the amount of time it takes for a system to respond to a user request. The APDEX metric is calculated using a formula that takes into account the number of satisfactory, tolerable, and unsatisfactory responses.

How Does it Work?

To calculate the APDEX score, organizations need to set two thresholds for response time. The first threshold is the satisfactory threshold and the second is the tolerable threshold. They are set based on the specific requirements of the system. Once the thresholds are decided, the APDEX formula is applied to the response time data. The APDEX formula is as follows: APDEX = (Satisfied Count + (Tolerated Count/2)) / Total Count

Where:

  • Satisfied Count is the number of responses that fall within the satisfactory threshold
  • Tolerated Count is the number of responses that fall between satisfactory and tolerating thresholds
  • Total Count is the total number of responses

The resulting score ranges from 0 to 1, with 1 being the best possible score. Based on the APDEX score the application’s performance is assessed:

  • Excellent, 1-0.94
  • Good, 0.93-0.85
  • Fair, 0.84-0.70
  • Poor, 0.69-0.50
  • Unacceptable, below 0.50

Advantages of the APDEX Metric

The APDEX metric has several advantages that make it a popular choice for application performance measurement. Some of these advantages include: Simplicity: The APDEX metric is easy to understand and use, making it accessible to organizations of all sizes and technical abilities. Standardization: The APDEX metric is a standardized tool, which makes it easy to compare the performance of different systems. Flexibility: The threshold for response time can be adjusted to suit the specific requirements of the system, which means that the APDEX metric can be applied to a wide range of systems.

Disadvantages of the APDEX Metric

Despite its popularity, the APDEX metric has also disadvantages that must be taken into account. Some of these disadvantages include: Lack of Variability: The APDEX metric does not account for the variability of performance over time, which means that it may not capture performance issues that occur at specific times or under certain conditions. Limited Scope: The APDEX metric is only based on the response time of a system, which is not the only factor that contributes to the user experience. Factors such as the availability of the system, reliability of the system, and functionality of the system also play a significant role in determining the user experience.

Conclusion

The APDEX metric can be a useful tool for measuring the performance of computer systems. It is easy to use, standardized, and flexible. However, it also has some limitations that must be considered before using it. Organizations should use a combination of metrics to get a more complete picture of system performance.

In recent release of JtlReporter the support for measuring the APDEX score was added. You can get the APDEX score for you JMeter or Locust.io test reports from now on - either get started with JtlReporter or upgrade your instance to the latest version. The metric was made optional and can be turned on in the scenario setting, while both threshold values are adjustable according to your specification and requirements of your system.
· 3 min read

Performance testing metrics are measurements that are used to evaluate the performance of a system or application under a given workload. These metrics help identify any issues or bottlenecks in the system and provide insights on how to improve its performance.

There are various performance testing metrics that can be used, depending on the specific goals and objectives of the test. Some common performance testing metrics include:

  1. Response time: This is the amount of time it takes for a request to be processed and for a response to be returned. A high response time can indicate that the system is overloaded or that there are bottlenecks in the system. For performance analysis it is very useful to use percentiles. The most common percentiles are p90, p95 and p99.
  2. Throughput: This is the number of requests that a system can handle per unit of time. A high throughput is desirable, as it indicates that the system can handle a large volume of traffic.
  3. Error rate: This is the percentage of requests that result in an error. A high error rate can indicate that the system is not functioning properly and needs to be optimized.
  4. Resource utilization: This is the percentage of a system's resources (such as CPU, memory, and network bandwidth) that are being used during the test. High resource utilization can indicate that the system is reaching its limits and may need to be scaled.

It's important to choose the right performance testing metrics for your specific goals and objectives. For example, if you're testing the performance of a web application, you may want to focus on metrics such as response time and error rate. If you're testing the performance of a database, you may want to focus on metrics such as throughput and resource utilization.

Performance testing metrics are an essential part of evaluating the performance of a system or application. By choosing the right metrics and monitoring them during the testing process, you can identify any issues or bottlenecks and make informed decisions on how to improve the system's performance.

JtlReporter can help you to gather all the above-mentioned (and many more!) metrics from your tests created with JMeter, Loucst.io and other performance testing tools. But it does not stop there. JtlReporter gives you the ability to customize the displayed metrics. Not to mention that the metrics are also displayed in comprehensive graphs. You can even easily compare the metrics with your other performance testing runs to find out any changes in performance of your application.

· 3 min read

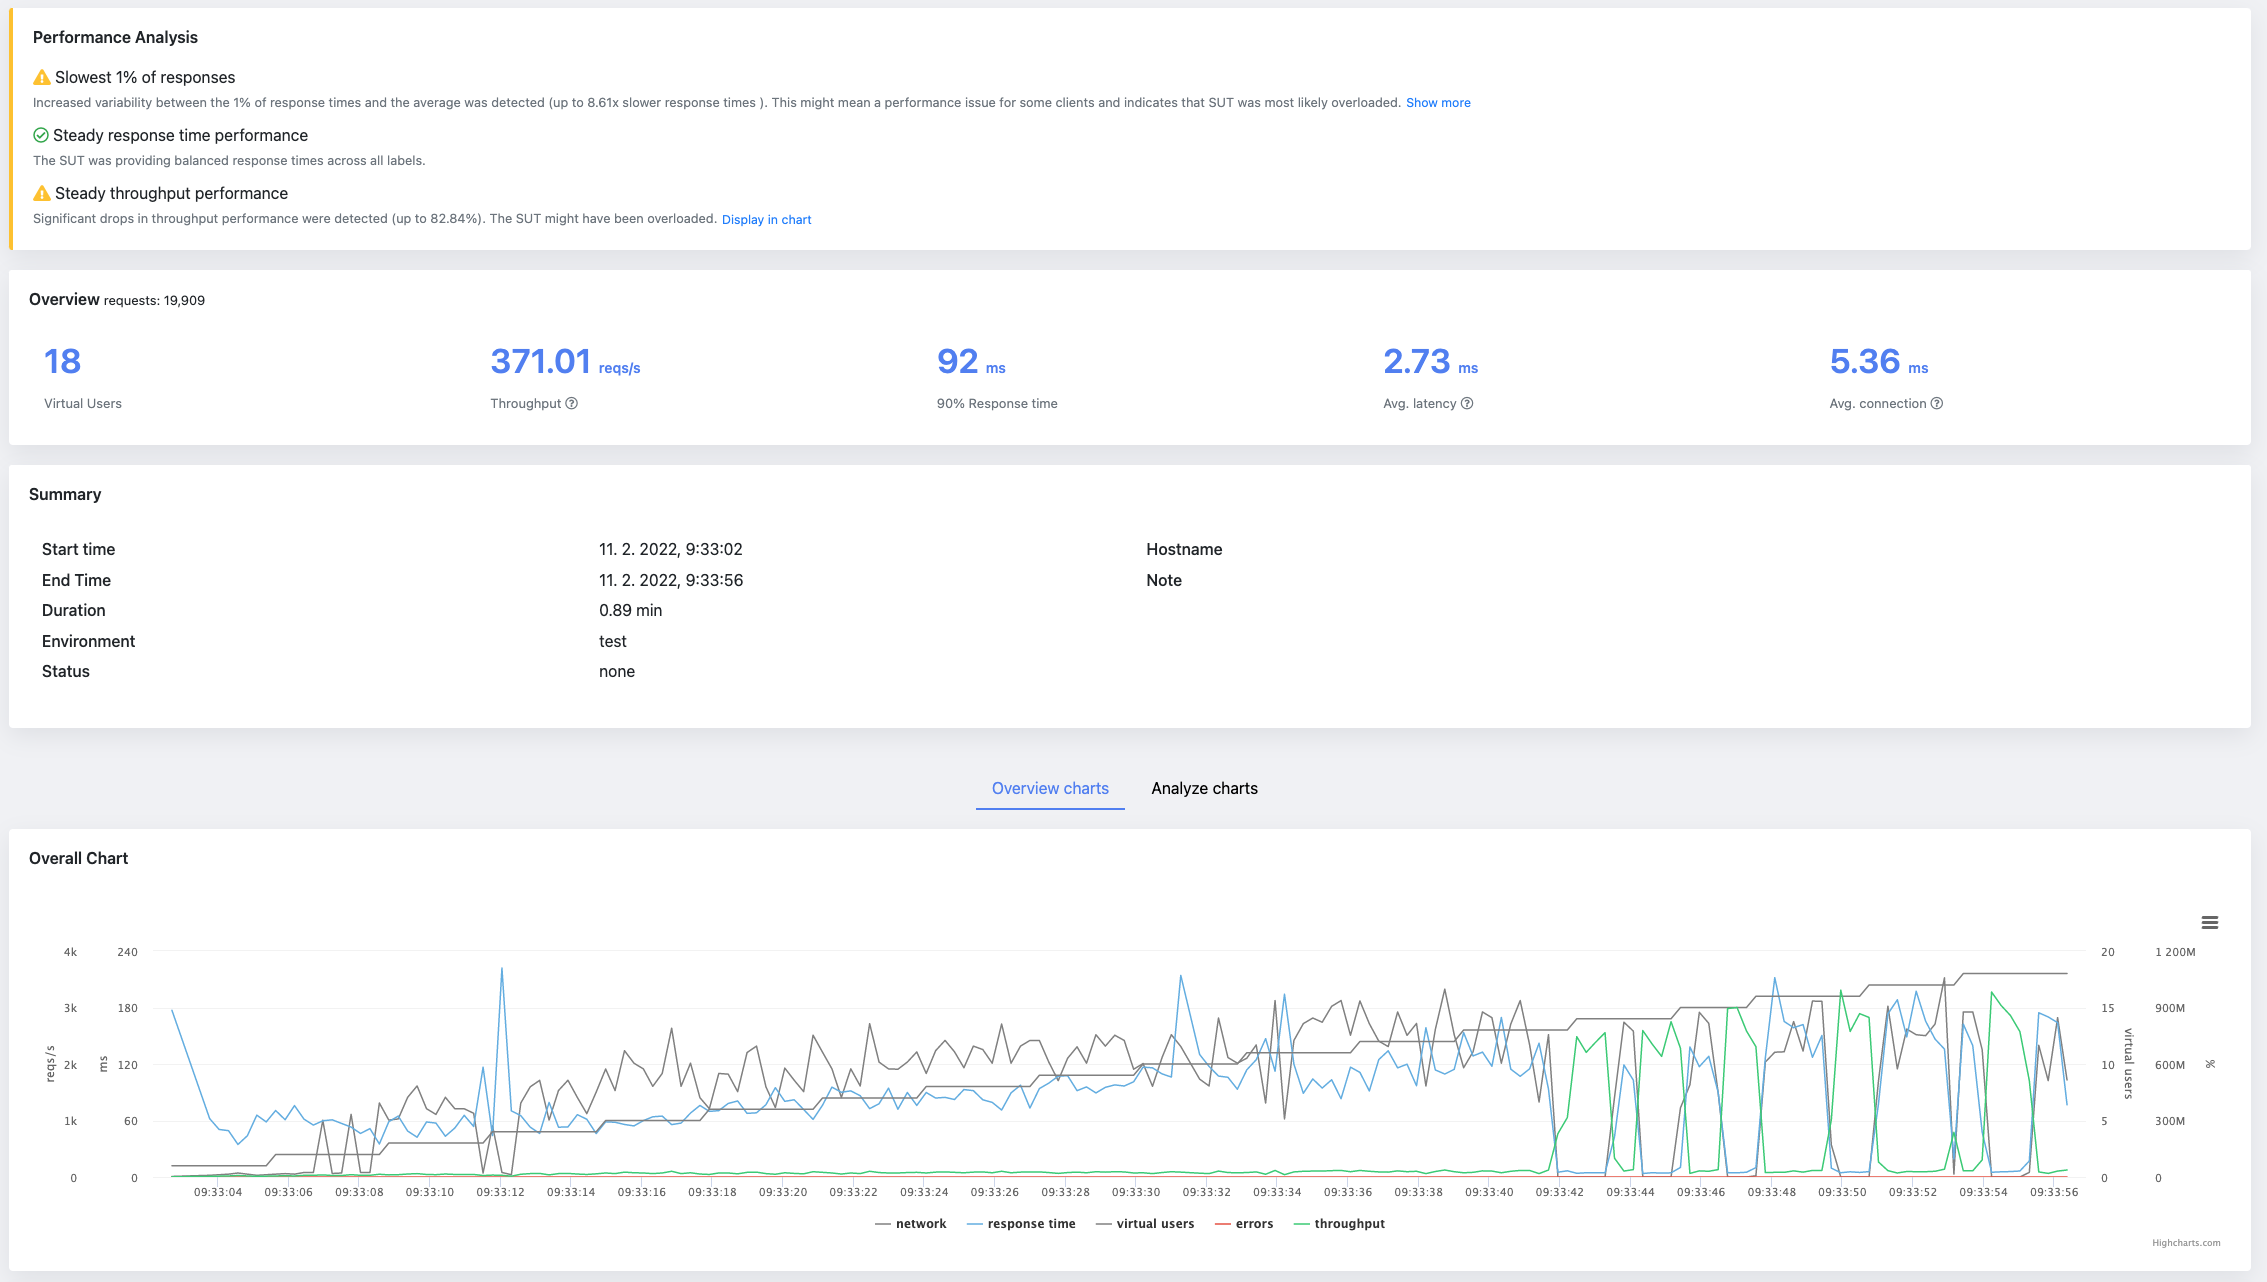
Performance testing is an important aspect of software development, as it helps ensure that a system or application can handle the expected workload and user traffic. A performance testing report is a document that outlines the results of a performance test and provides insights on the system's performance under various conditions.

Report

There are various types of performance tests, including load testing, stress testing, and endurance testing. Load testing involves simulating a normal workload on the system to ensure it can handle the expected traffic. Stress testing involves increasing the workload beyond normal levels to see how the system performs under increased demand. Endurance testing involves running the system at a high workload for an extended period of time to ensure it can sustain that level of performance.

A performance testing report should include a summary of the test objectives, the testing environment, and the test results. It should also include any issues or bottlenecks that were identified during the testing process and provide recommendations for improvement.

One key aspect of a performance testing report is the use of performance metrics. These metrics can help identify areas of the system that may need improvement and provide a baseline for future performance testing. Common performance metrics include response time (90, 95 and 99 percentiles, average, min and max), throughput, error rate, connection time, networks stats. All of these metrics are provided in JtlReporter. The more, you can adjust the displayed metrics as wanted - by default the application shows all the metrics in the table, but if you feel it's too overwhelming you can easily limit it.

Request stats

Another important aspect of a performance testing report is the presentation of the results. The report should include graphs and charts to clearly show the test results and make it easy for readers to understand the findings. JtlReport renders all basic graphs for overall performance, but also for individual labels and its various metrics. But it does not stop here. It even adds a possibility to display a trends for individual labels - you will get a history timeline of a performance per label.

Label trend

But it also gives you the possibility to create custom charts where you can combine all the available metrics as wanted to find the desired correlation. This custom chart is saved per user session and loaded when report is opened.

Performance testing report is a valuable document that provides insights on the performance of a system or application under various conditions. It can help identify issues and bottlenecks, provide recommendations for improvement, and serve as a baseline for future performance testing.

Do you want to get more from your JMeter or Locust.io performance test? Get started with JtlReporter.