
6 posts tagged with "report"

View All Tags

· 5 min read

Performance testing stands as a critical phase in the software development lifecycle, aiming to identify potential bottlenecks and ensure that the application meets its performance criteria under anticipated user loads. At the heart of performance testing lies the concept of the degradation curve, a powerful tool that provides insights into how an application's performance changes under various load conditions. This comprehensive guide delves into every facet of degradation curves in performance testing, equipping you with the knowledge to leverage this tool for enhancing application performance and user satisfaction.

Response Time Degradation Curve

What is a Degradation Curve?

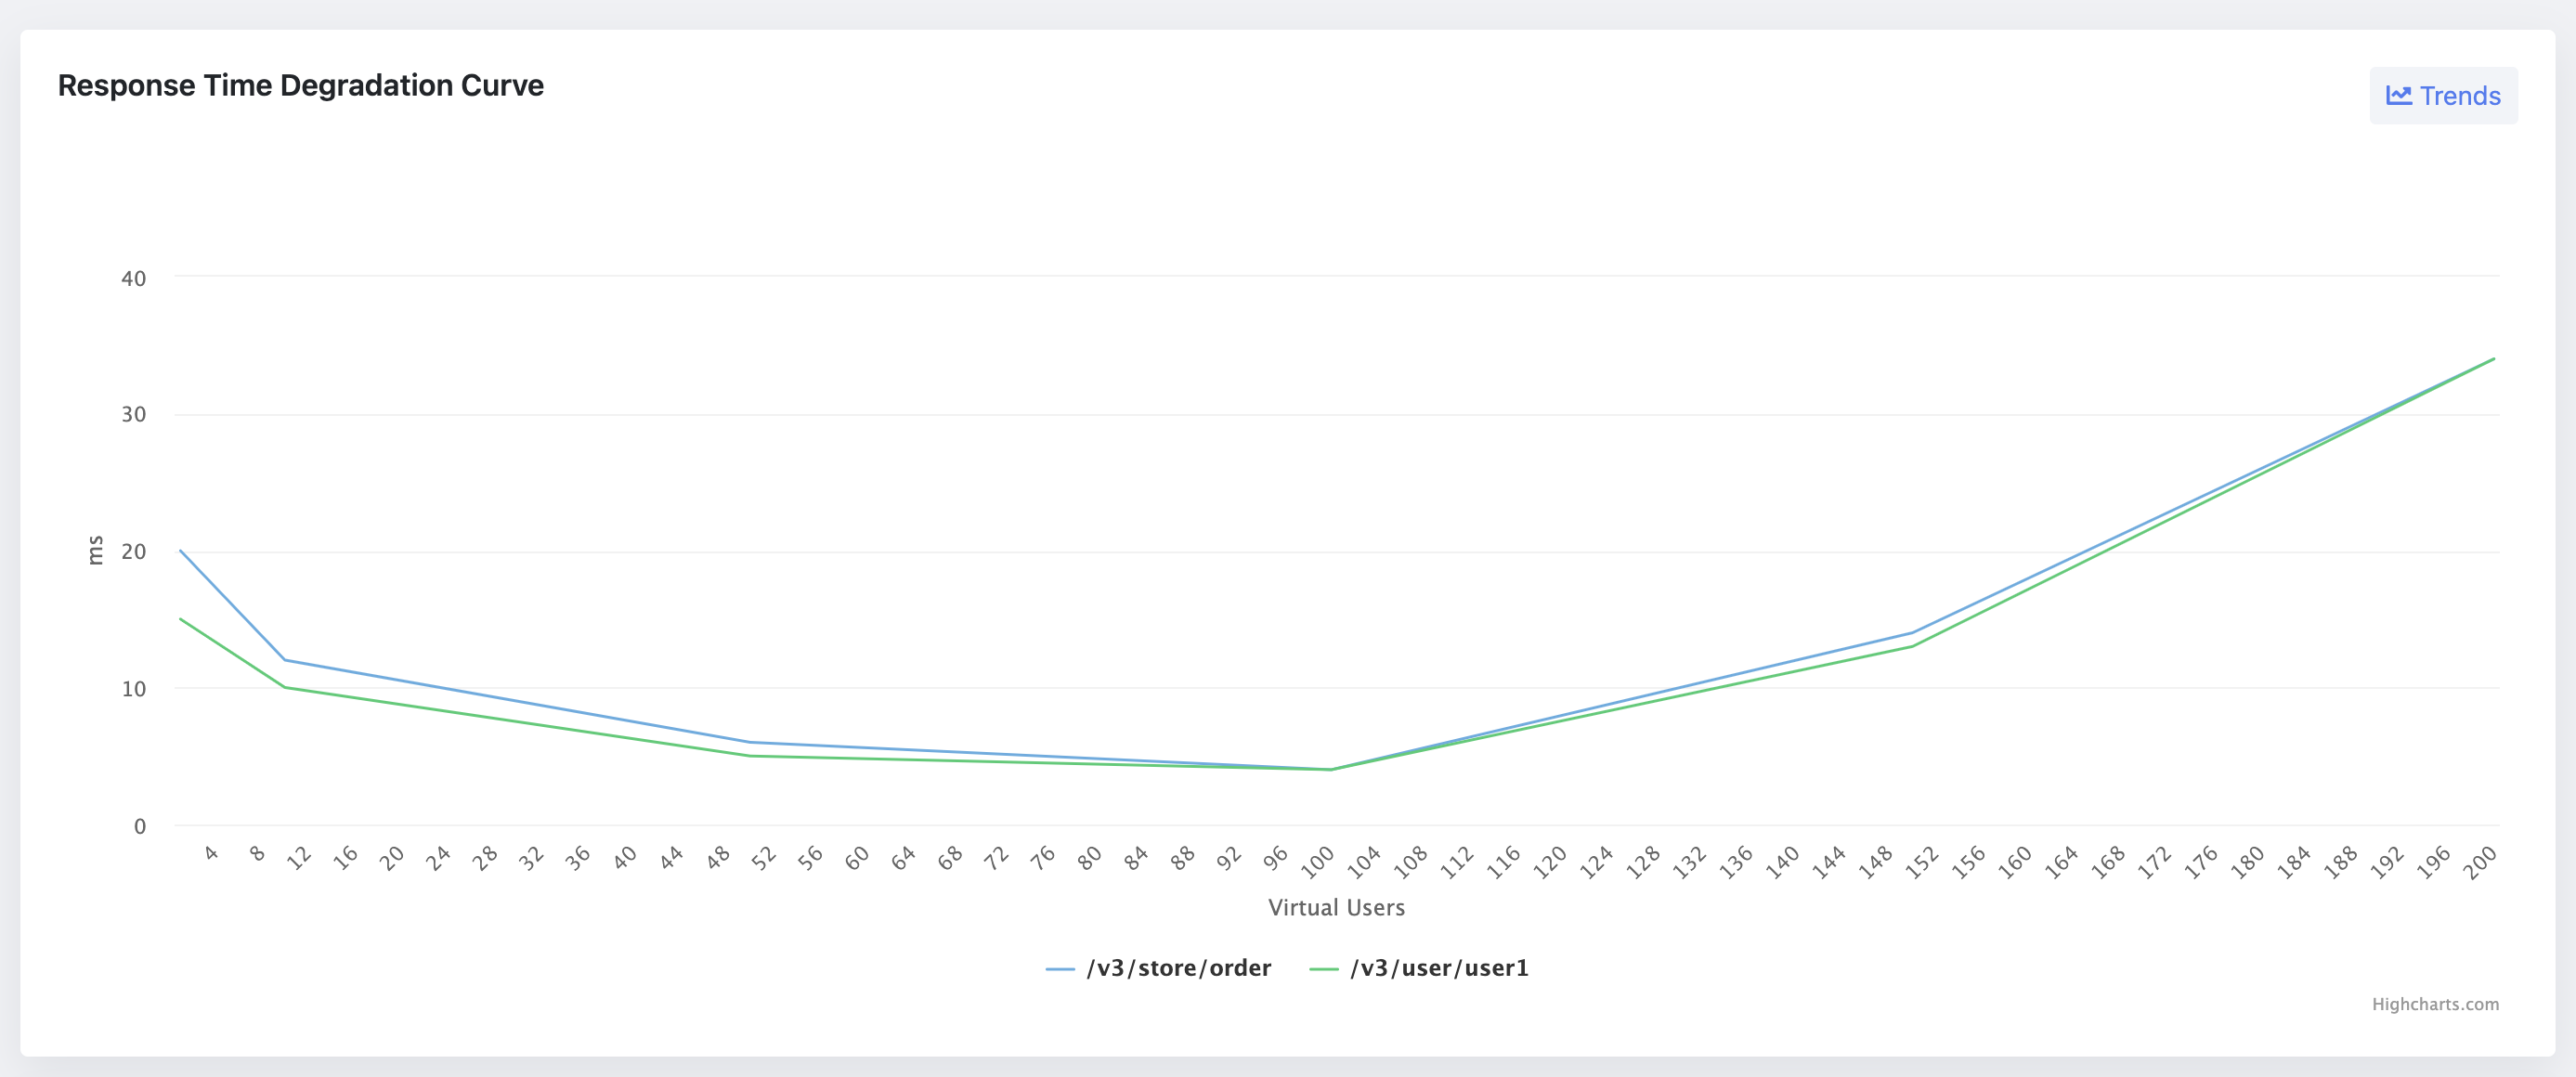
A degradation curve, in the context of performance testing, plots the relationship between load (number of users) and response time for a system. It is pivotal in understanding how an application's performance degrades, or worsens, as the load increases. The curve typically features several key regions: the single-user region, performance plateau, stress region, and the knee in performance.

The Role of Degradation Curves in Performance Testing

Degradation curves serve multiple purposes in performance testing, including:

  • Identifying Performance Plateaus and Stress Areas: These curves help testers pinpoint the load levels at which an application maintains steady performance (performance plateau) and the points at which performance starts to degrade significantly (stress areas).
  • Determining "Good Enough" Performance Levels: By understanding where performance starts to degrade, teams can make informed decisions about acceptable performance levels for their applications.
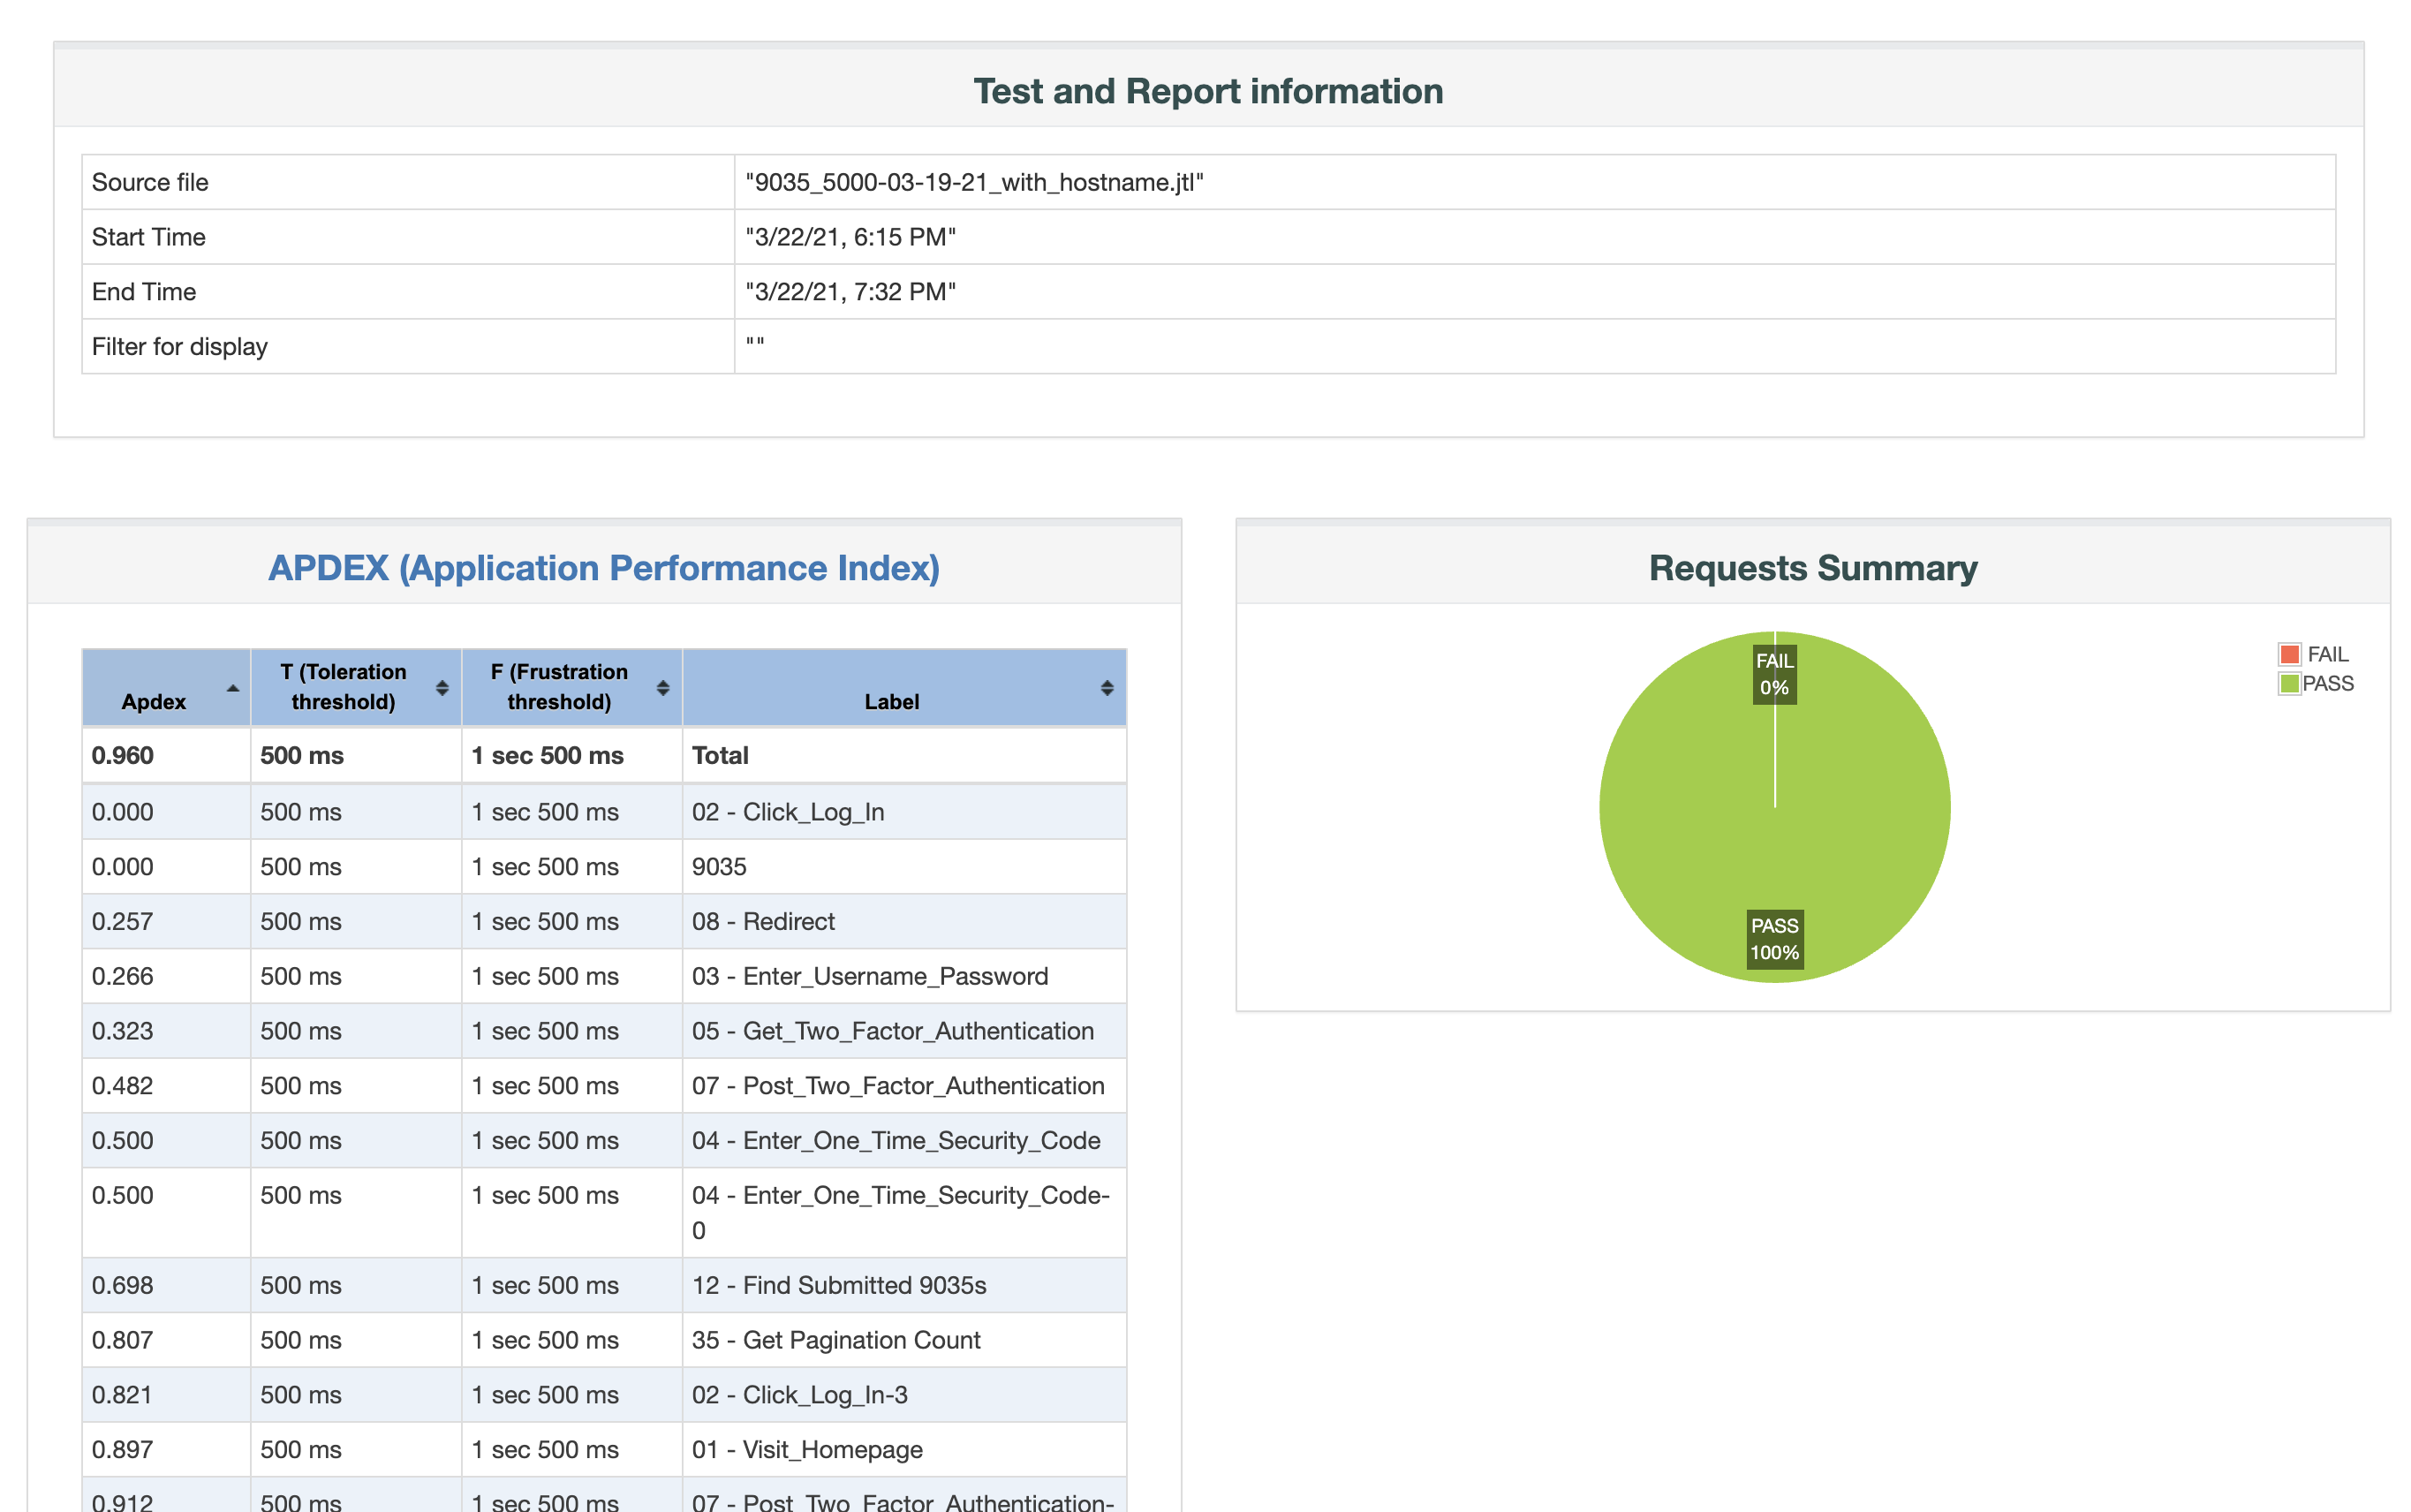
  • Correlating Performance with User Experience: Degradation curves offer insights into how performance issues might affect end-user experience, helping teams prioritize performance improvements.

Analyzing Degradation Curves

Components of a Degradation Curve

  1. The Single-User Region: This part of the curve represents the response time when only a single user is accessing the system. It provides a baseline for optimal performance.
  2. The Performance Plateau: This region indicates the range of a user load under which the application performs optimally without significant degradation.
  3. The Stress Region: Here, the application begins to degrade gracefully under increasing load, marking the onset of performance issues.
  4. The Knee in Performance: This critical point signifies where performance degradation becomes severe, indicating the maximum load the application can handle before experiencing unacceptable performance.

Interpretation of Degradation Curves

Interpreting degradation curves requires understanding the nuances of each region:

  • Single-User Region: Ideal response times here set the expectation for the application's best-case performance.
  • Performance Plateau: Identifying this area helps in understanding the optimal load range and setting realistic performance benchmarks.
  • Stress Region and Knee in Performance: These indicate the limits of acceptable performance, guiding performance tuning efforts and capacity planning.

Building Performance-Degradation Curves

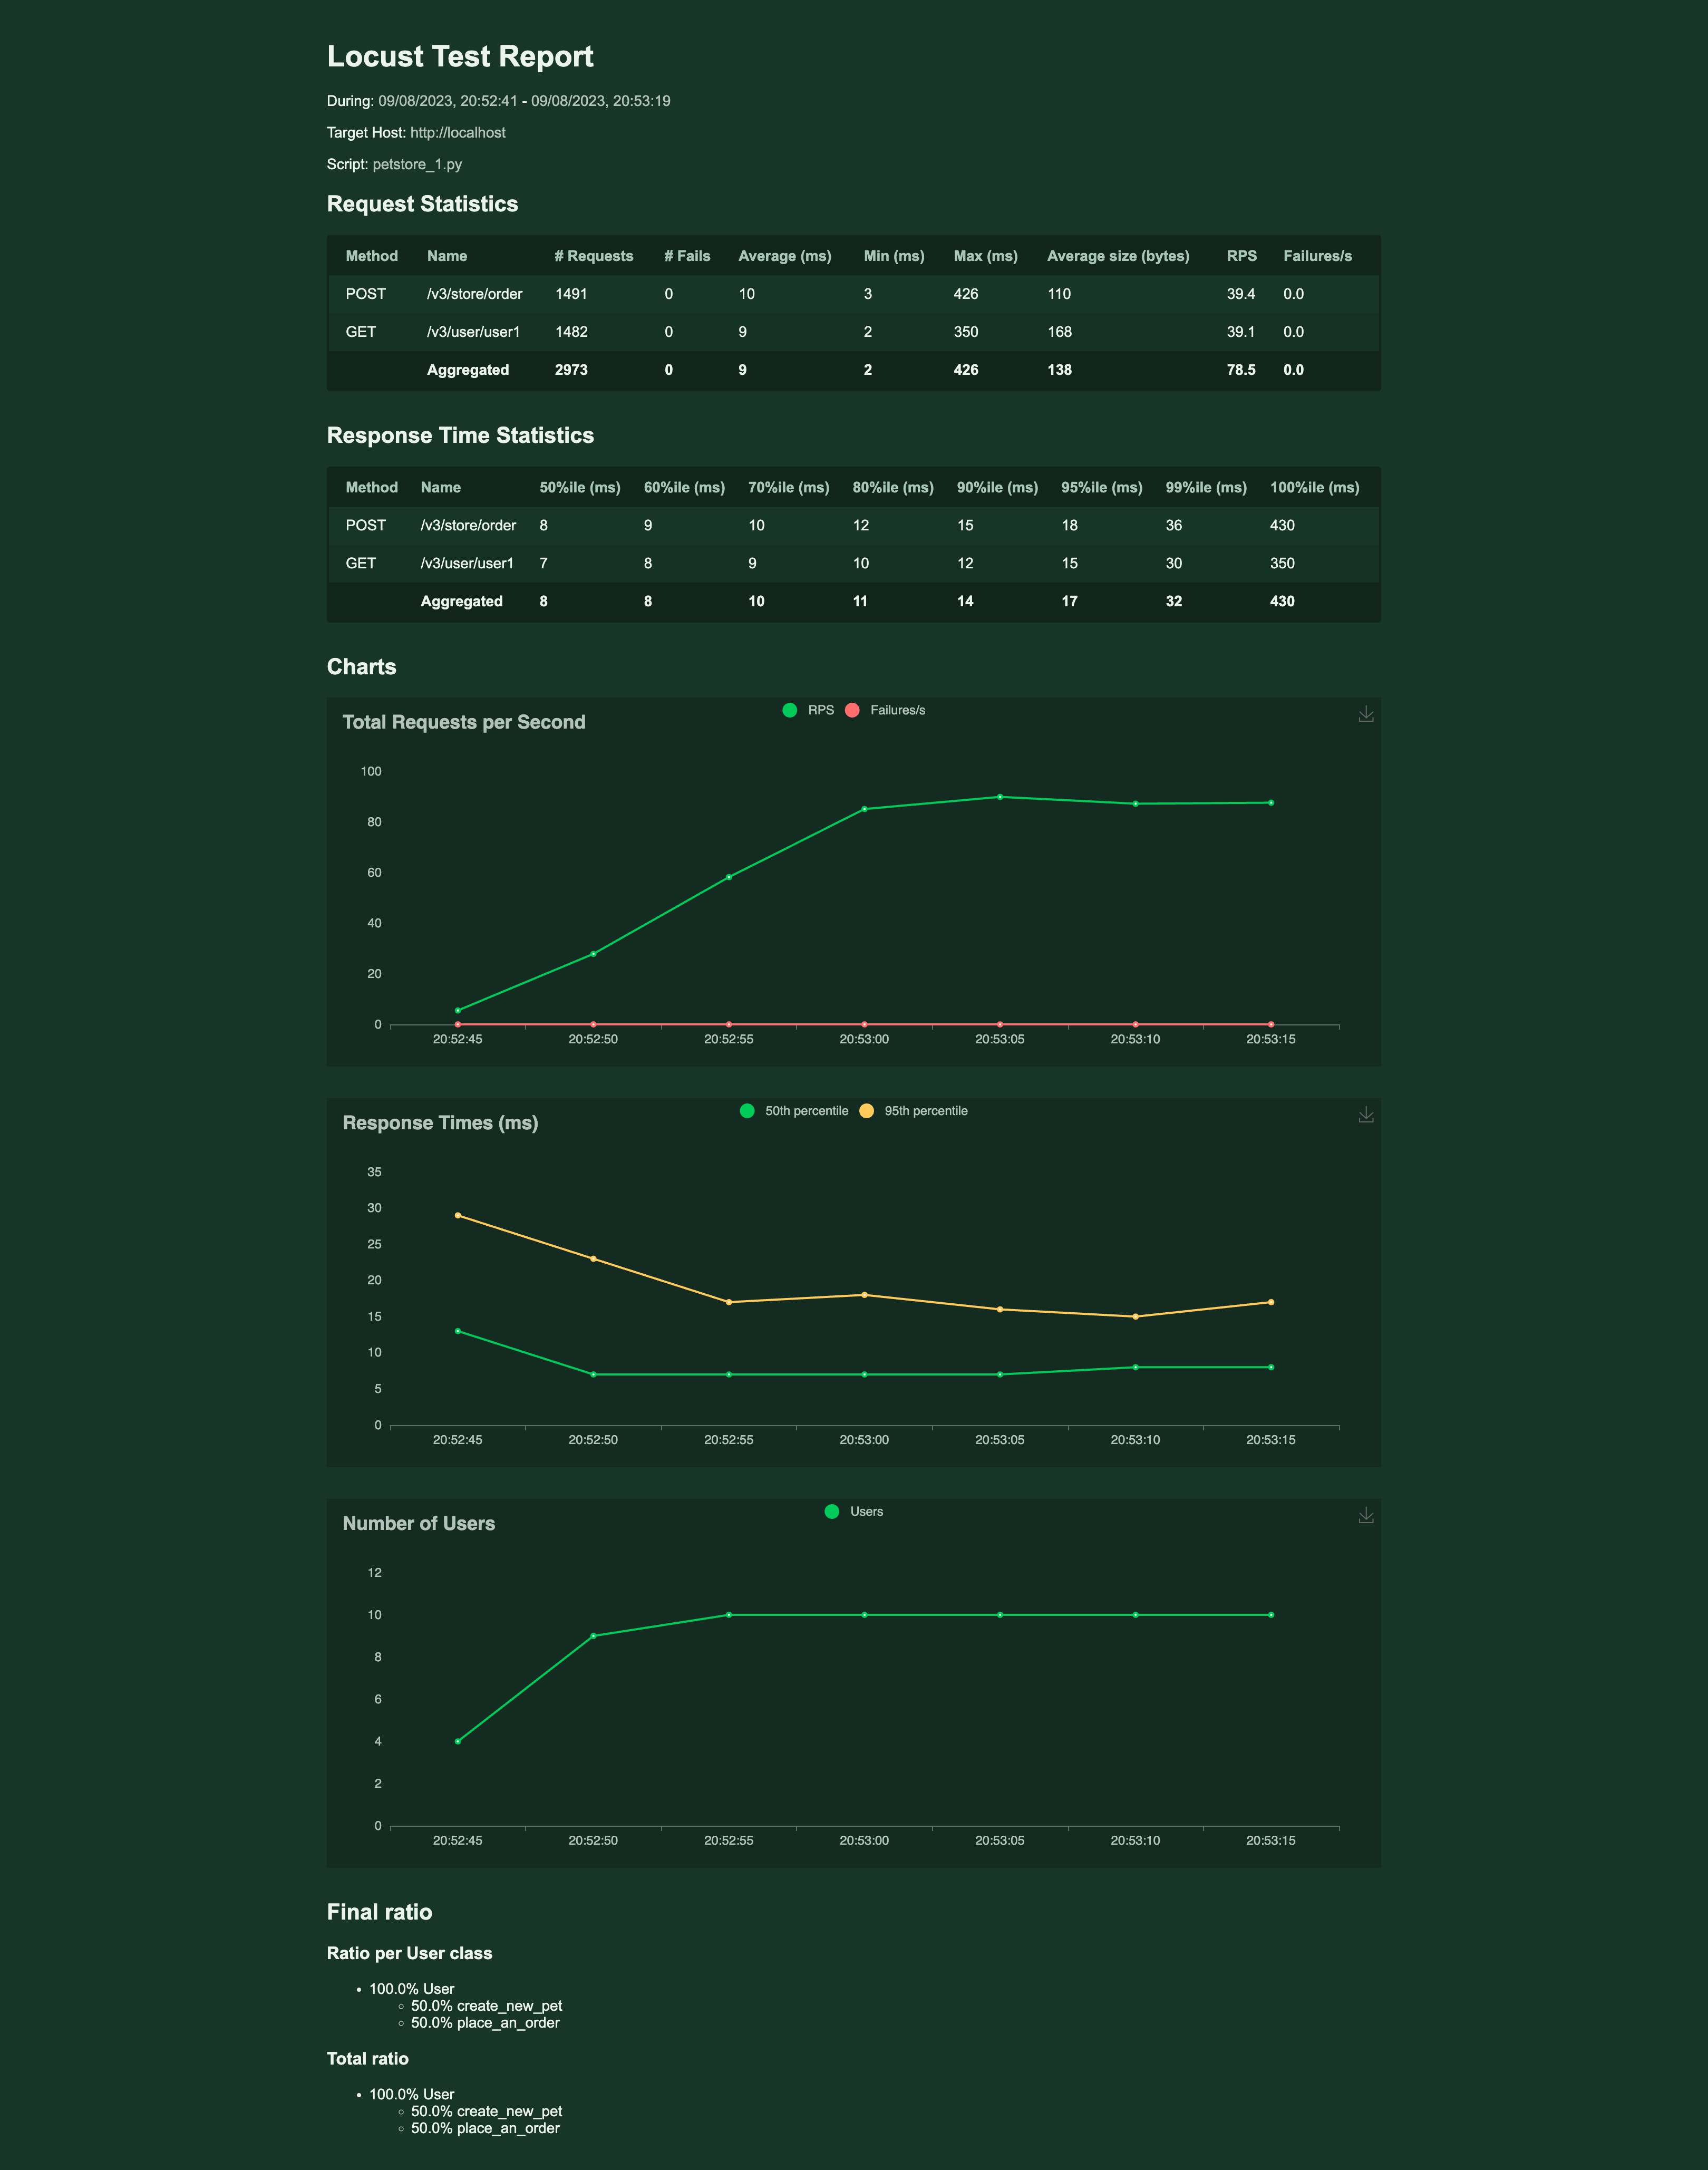
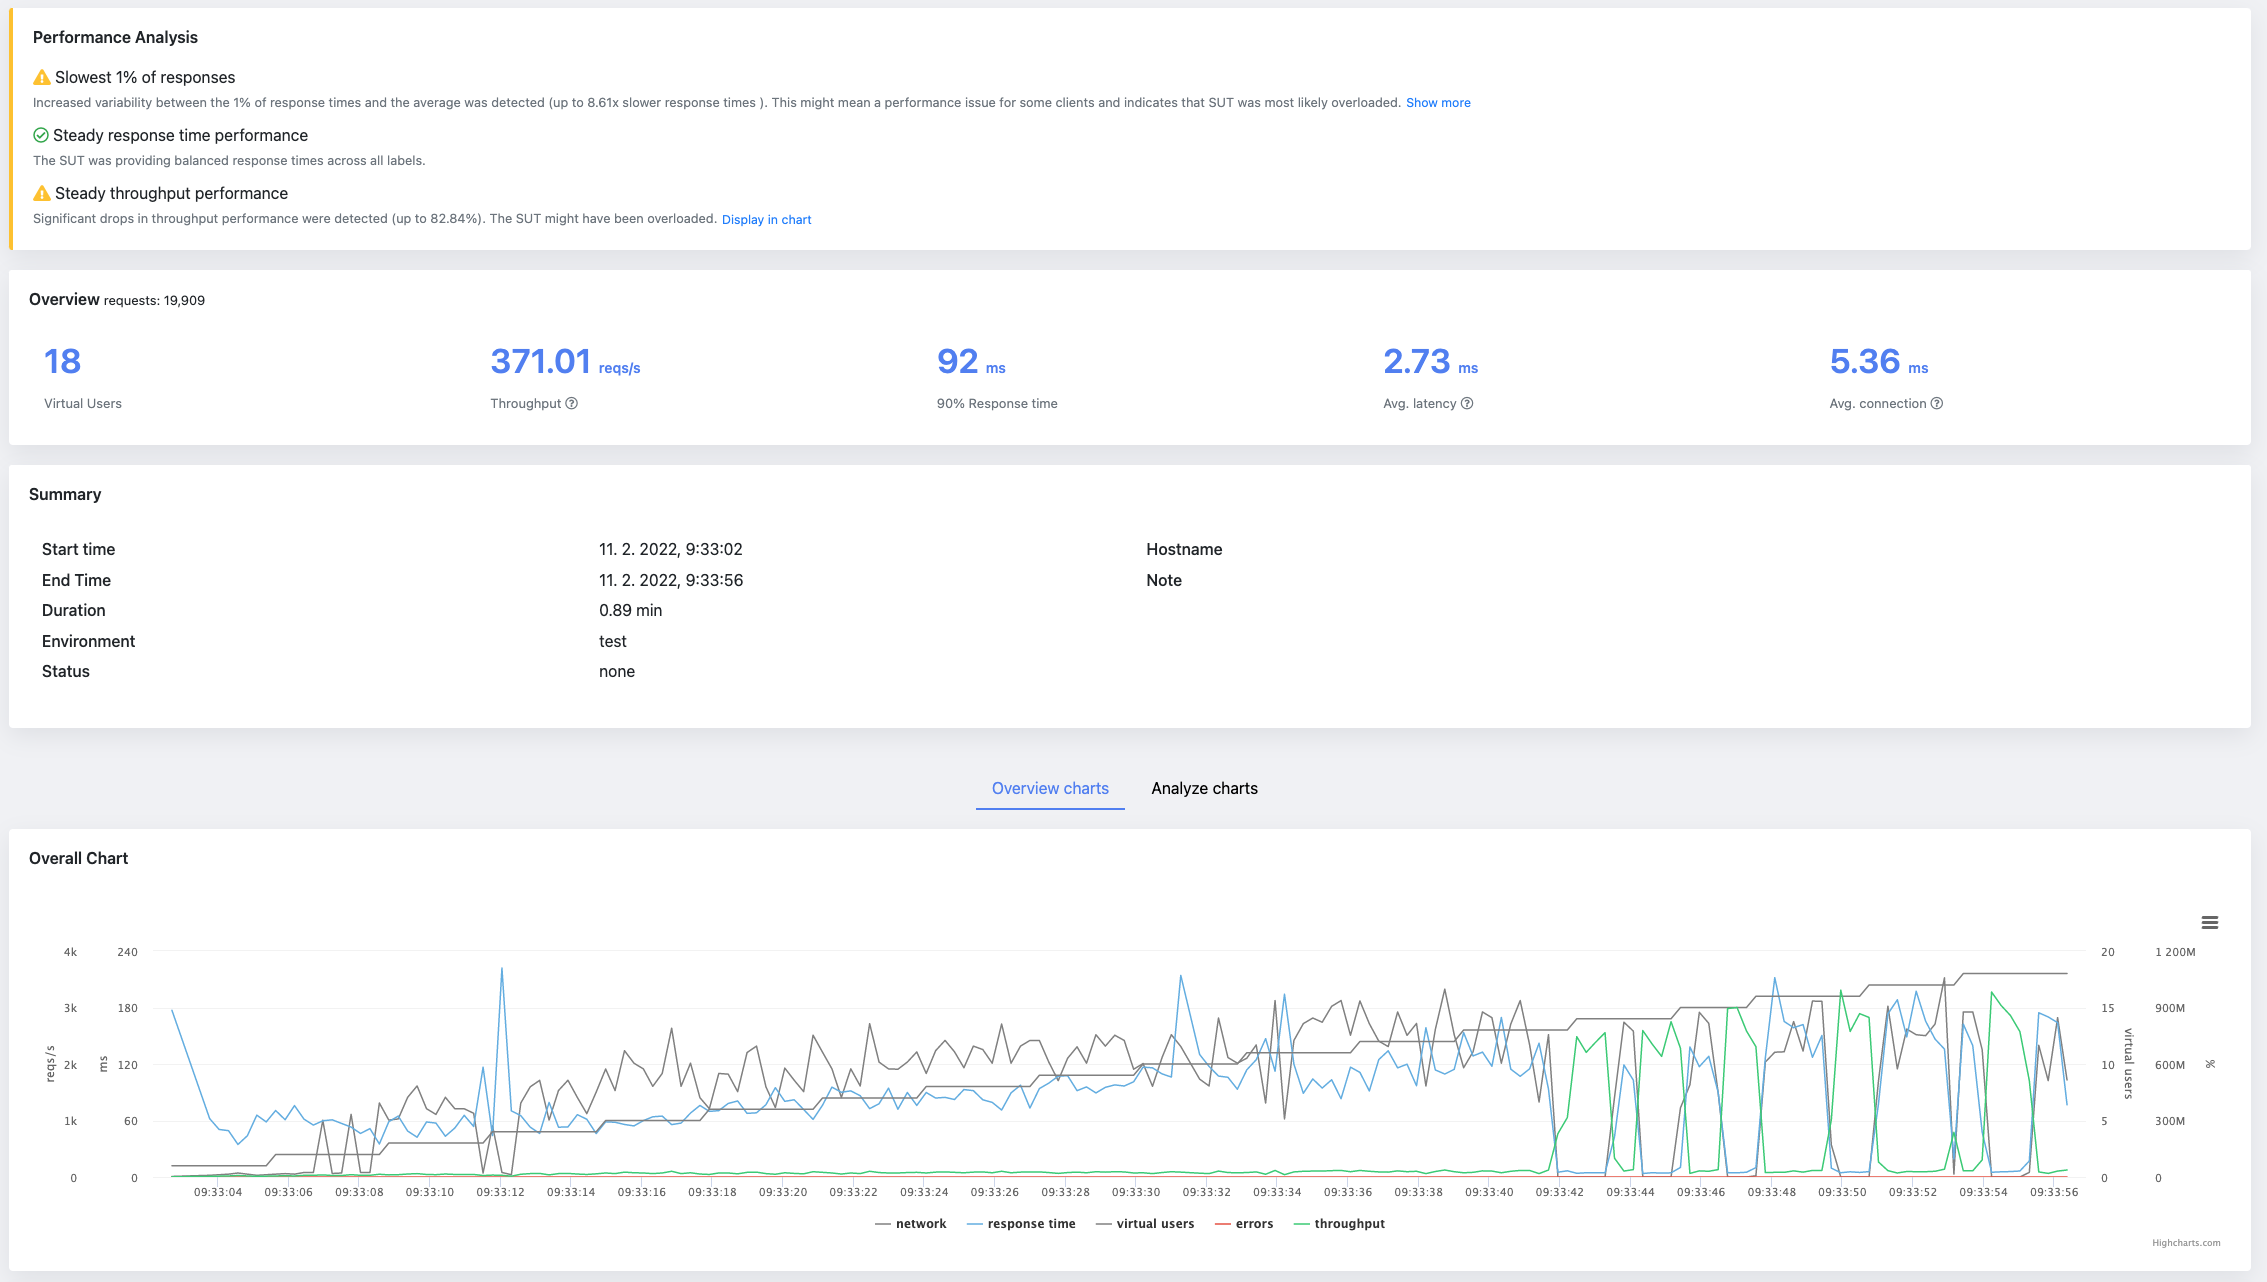
Creating a degradation curve involves a series of steps, starting with setting up the performance testing environment and culminating in the analysis of gathered data. Key tools and technologies for generating degradation curves include load testing tools like JMeter, LoadRunner, and Gatling. These tools simulate various user loads on the application and measure the response times at each load level. Step-by-Step Process for Creating a Degradation Curve

  1. Setting Up the Performance Testing Environment: This involves configuring the test environment to mimic the production environment as closely as possible.
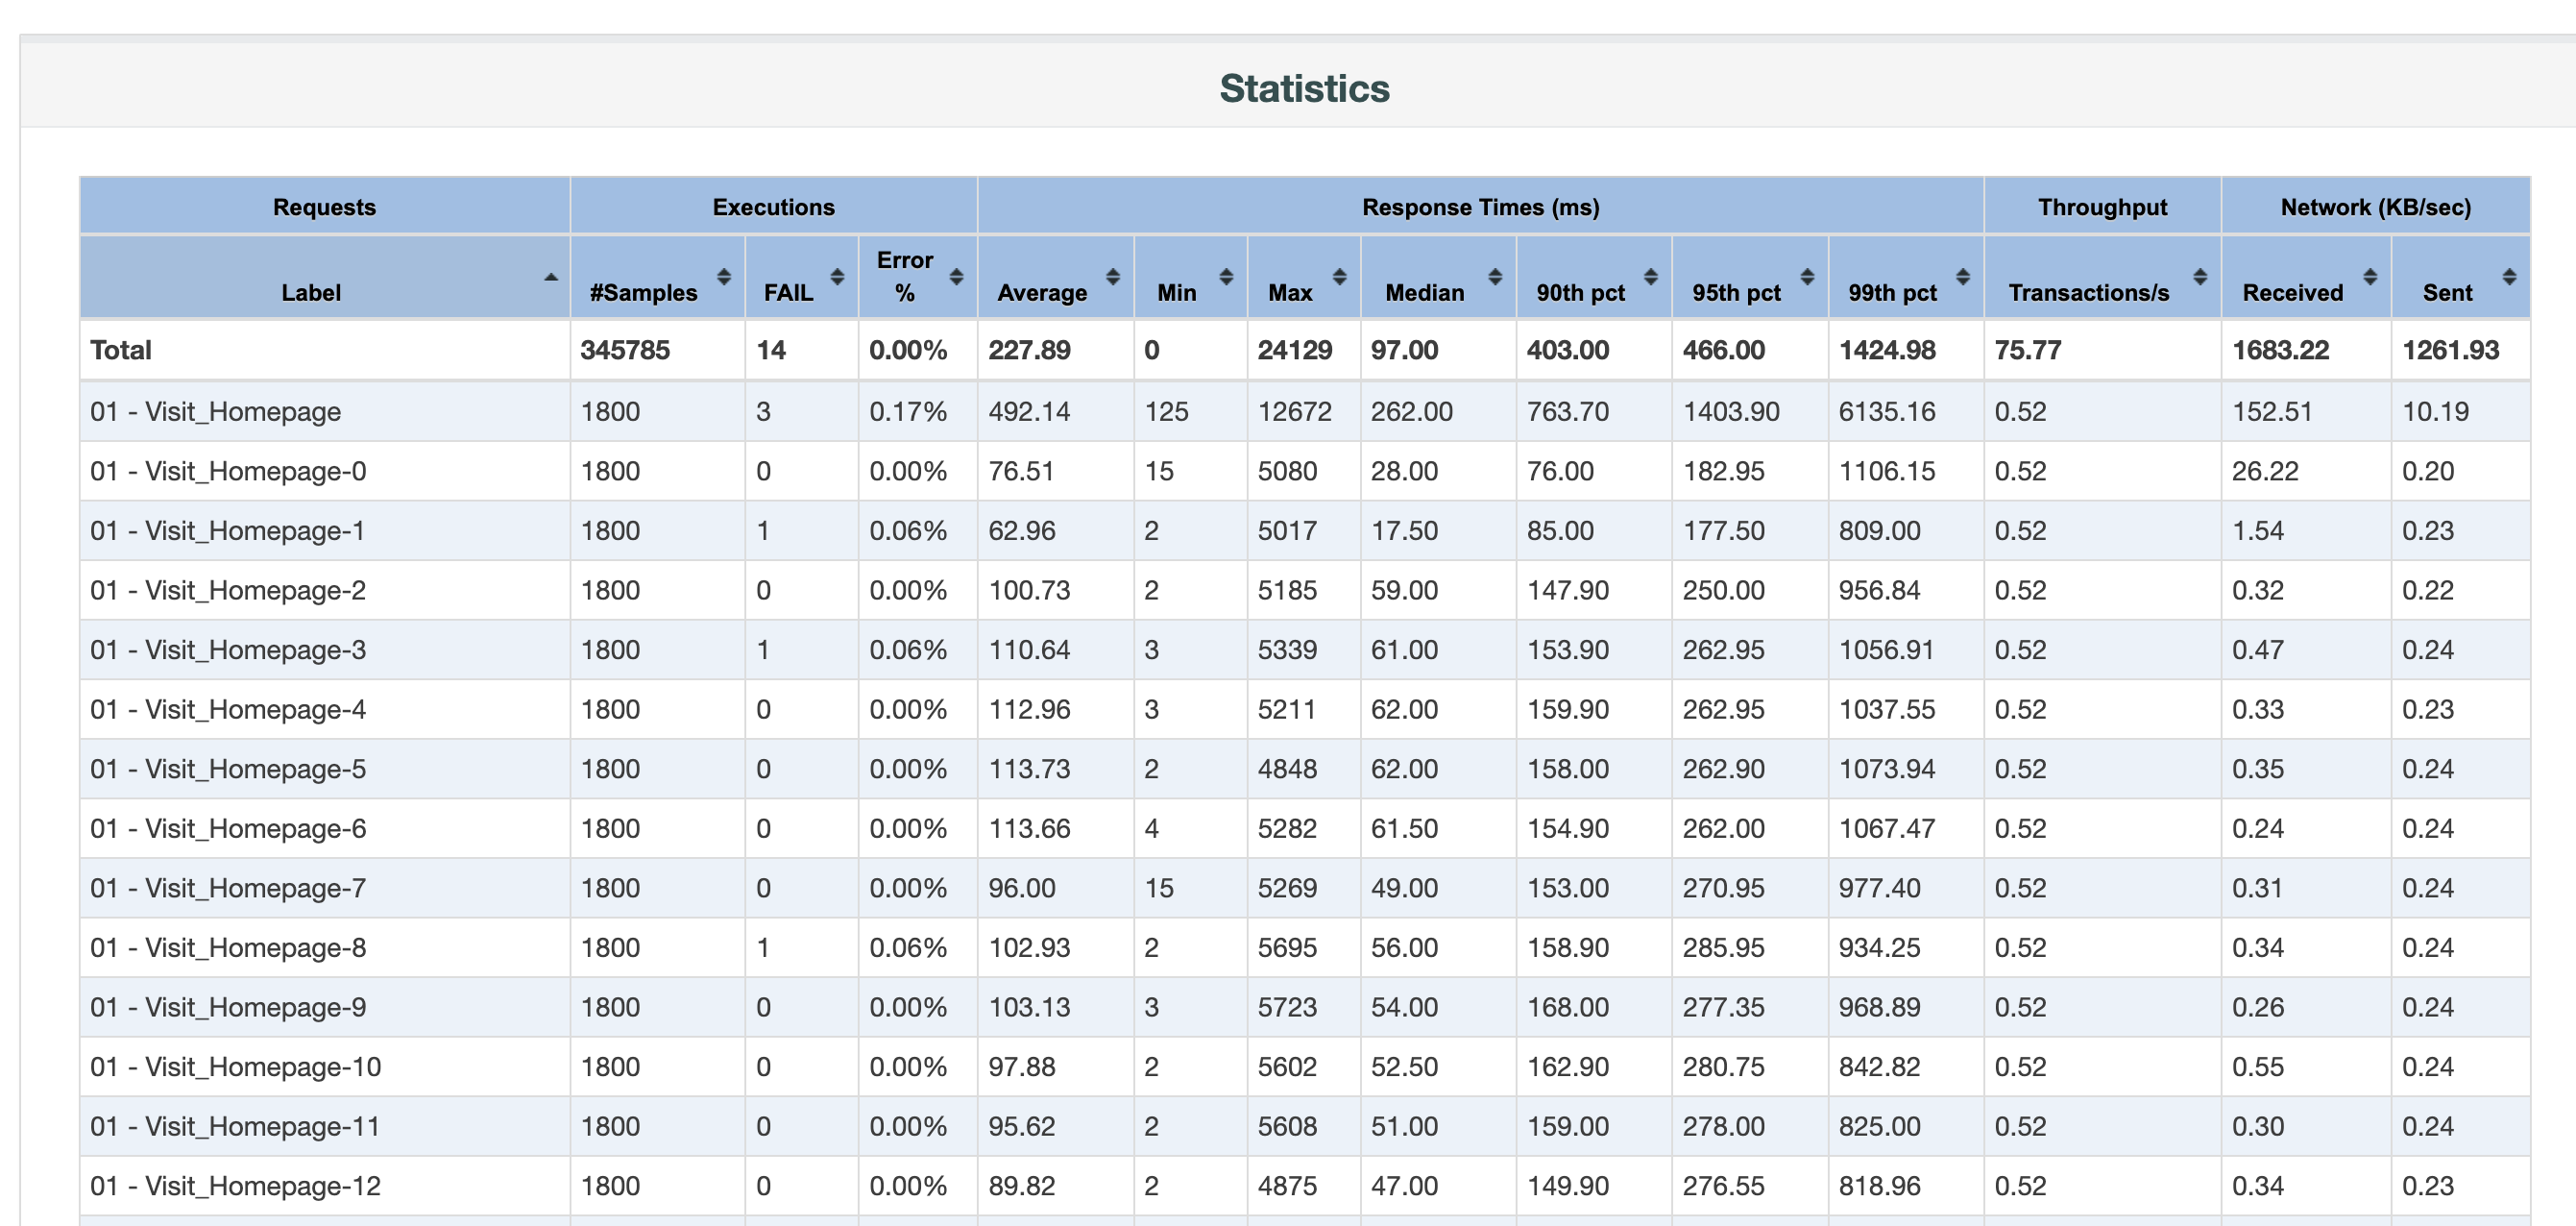
  2. Executing the Test and Collecting Data: Tests are run at incremental load levels to gather data on response times and other relevant metrics.
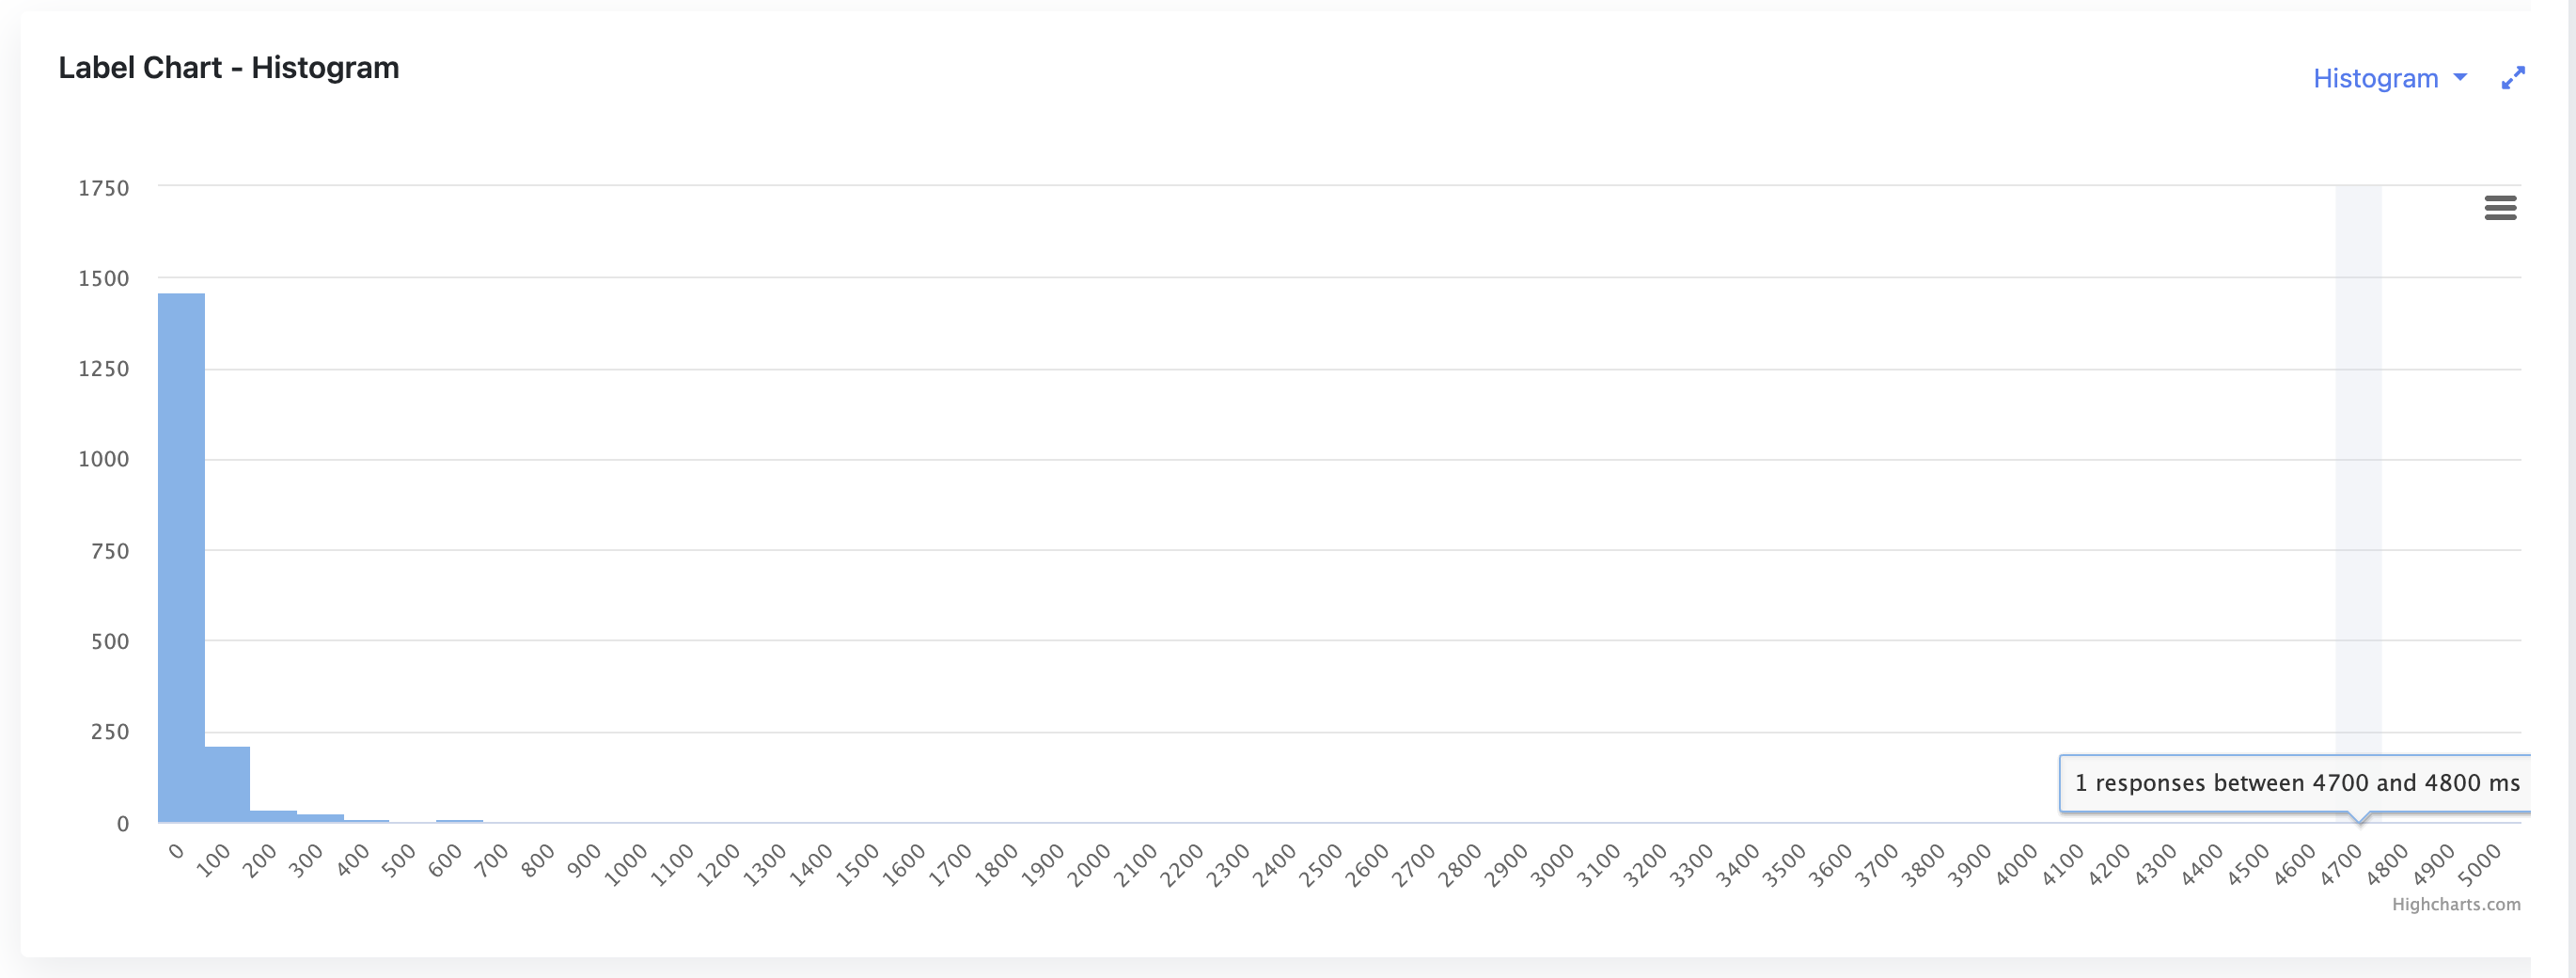
  3. Plotting the Degradation Curve: Using the collected data, a curve is plotted with load levels on the x-axis and response times on the y-axis.

Complex Performance-Testing Scenarios

Understanding and analyzing degradation curves becomes even more critical when dealing with complex performance-testing scenarios. These scenarios might involve varying user behaviors, concurrent access patterns, or the introduction of new application features that could potentially alter performance dynamics.

Modeling User Behavior and Workload Distribution

Creating sophisticated models that simulate real-world user interactions with the application is key. By incorporating these models into performance testing, teams can generate more accurate degradation curves that reflect a wide range of user behaviors and workload distributions. This approach enables a deeper understanding of how different user types impact application performance.

Applying Degradation Curves to Complex Scenarios

In complex scenarios, degradation curves can illustrate how changes in user behavior or workload distribution affect application performance. For example, an increase in the number of users performing data-intensive operations might shift the performance plateau earlier in the curve, indicating a need for optimization in handling such operations.

Strategies for Performance Improvement

Once degradation curves have been analyzed, the next step involves using this data to guide performance improvement strategies. This might include identifying and addressing bottlenecks, optimizing code, or scaling infrastructure.

Degradation curves can highlight performance bottlenecks by showing where response times begin to degrade significantly. Identifying these bottlenecks is the first step toward implementing fixes, which might involve code optimization, database indexing, or enhancing server capacity.

The goal of performance tuning is often to shift the knee in the degradation curve to the right, thereby increasing the maximum load the application can handle before performance degrades ungracefully. This can be achieved through various strategies, including optimizing application code, improving database performance, and scaling out infrastructure.

Conclusion

Degradation curves are a powerful tool in the performance tester's arsenal, offering detailed insights into how applications behave under load. By understanding and applying the principles outlined in this guide, testing teams can enhance application performance, meet user expectations, and ultimately contribute to the success of their software projects.

Generate Degradation Curve With JtlReporter

Traditionally, creating the degradation curve was done in Excel or any other similar tool. This is indeed a very manual and not too scalable solution. As the test scenario, outcomes had to be copied from the test outputs from tools like JMeter, Locust, Gatling, etc. and copied into Excel. With every new test result, the procedure must be done again. With JtlReporter you get the degradation curve for each scenario out of the box, without any manual steps needed.

· 6 min read

Locust.io is a highly effective open-source performance testing tool designed to help developers ascertain how their systems will function under the stress of multiple users. By simulating simultaneous users, locust.io provides comprehensive insights into system performance and potential points of failure. It's Python-based and allows developers to write test scenarios in the form of Python scripts. This offers a significant degree of flexibility when it comes to generating specific user behaviors. The software is easy to use and offers efficient load-testing capabilities, including an informative HTML report feature. This article delves into how to generate and understand these HTML reports to make the most of locust.io for optimum system performance.

Locust.io HTML Report

Procedure to Generate HTML Report Using Locust.io

Creating an HTML report in locust.io is a relatively straightforward process that delivers insights into your system's performance. Follow these steps to create your own HTML report:

The article assumes locust.io is installed on your machine, and you have an existing locust script.

  1. After writing test cases, run locust using the command line. Use the following command: locust -f locustfile.py --html=report.html. Replace "locustfile.py" with your file's name, and "report.html" should represent the name of your output file.
  2. Open the locust interface, typically running at http://localhost:8089. Set the number of total users to simulate and spawn rate, then start swarming to initiate the test.
  3. Once you have finished the test case, an HTML report will be automatically generated.

Generating these regular reports is vital for assessing performance over time, which allows developers to catch potential problems early and avoid system breakdown due to high loads. It aids in monitoring system behavior under various load patterns, aiding in detecting bottlenecks, capacity constraints, and possibilities for optimization. By comprehending these reports, one can better maintain system stability and ensure an excellent user experience.

Understanding the Report

Understanding locust.io's HTML report is crucial to extract useful insights about your system's performance. Testing with locust.io results in an HTML report with several data fields and sections. Here's how to interpret the key sections.

Statistic Table

The report opens with a statistic table that includes the number of requests made, their distribution, and frequency. Three key parameters here are:

  • Requests/sec: This is the number of completed requests per second.
  • Fails: This includes the counts and the percentage of failures.
  • Failures/sec: This is the number of failed requests per second
  • Median & Average Response Time: These figures indicate how long it took to process the requests, with the median being the middle value in the time set. But please note, that average is not the best metric to follow, actually they might be a misleading metric.

Distribution Stats

This table shows the distribution of response times, which is vital to understand the user experience at different percentiles of the load. The most often considered percentiles are p50(median), p90, p95 and p99. If the concept of percentile is new to you, please check Performance Testing Metric - Percentile, as this is metric is crucial in performance testing.

Charts

In the end, there are three different charts displaying the number of users, Response times, and Requests per second. These charts provide a visual reference for the system's performance over time. As you can see those are aggregated charts from all request, you cannot see there charts for individual requests.

These data points collectively provide a basic view of how the system performed under the simulated load. Those charts can provide some insights into application performance overtime, but won't reveal subtle nuances - such as performance drops in individual requests. Those drops can be easily hidden in the aggregated charts.

Key Metrics Measured by Locust.io

Key metrics are fundamental to assessing how well your system performed under testing. Some of the crucial metrics measured by locust.io include the following.

  • Response Time: This is the time taken by a system to respond to a user request. It is provided in locust.io's report in various forms - percentiles, average, min and max response time. Lower response times generally indicate better performance. Unfortunately, Locust.io does not provide us with standard deviation, which is helpful in system performance stability assessment. Instead, you could have a look at the difference between min response time and average. If the there is a big difference between them, it might indicate a performance bottleneck.
  • Error Rate: Represented as 'Fail' in the report, this measures the number and percentage of failed requests in relation to total requests made. In an ideal situation, the error rate should be zero; however, when performing intense load-testing, it's common to see some errors which can help identify potential weak points or bugs in the system.
  • Requests Per Second: This denotes the number of requests a system can handle per second. A higher number indicates better system performance. It plays a crucial role in determining if your system can handle high traffic while still providing decent response times. Please refer to our other article if you would like to know the difference between the number of virtual users and RPS.

These metrics, in conjunction with others provided in locust.io's HTML report, provide a basic overview of your system's performance under load. By regularly monitoring these metrics, developers can ensure their systems are always ready to handle actual user traffic.

Decoding Performance Metrics with Locust.io & Glimpsing Beyond with Jtl Reporter

In conclusion, locust.io provides a robust and reasonably detailed approach to performance testing with its capacity to simulate thousands of users and generate insightful HTML reports. Its easy-to-understand report format allows developers to interpret key metrics such as response time, error rate, and requests per second effectively. Regular report generation is also vital to continually improve system performance and catch potential problems early.

However, while locust.io's HTML offers neat features, alternatives like JtlReporter offer more flexibility and features. JtlReporter can provide rich analytic features, supportive visual charts, and even storage options for test results. Its user-friendly interface and detailed analysis can provide a comprehensive overview of system performance, which can be a perfect fit for highly complex large-scale systems. Therefore, while utilizing locust.io for performance testing, give a JtlReporter a try.

· 4 min read

JMeter, a popular open-source software tool designed for load testing and performance measurement, provides a built-in reporting feature known as the 'Dashboard Report'. The Report gathers or collates the results of performance tests, depicting them in an easy-to-comprehend tabular format and graphs. In this article we will have a look at the "Statistics" table.

Although the detailed process of generating this report is beyond the scope of this article, we have another post where you can find out how to generate the JMeter Dashboard Report.

The Importance of the Statistics in JMeter Report

The Statistics table in JMeter Dashboard Report is an integral part of performance testing analysis due to its comprehensive view of test results. It presents summarized information, including the average, median, and percentiles of response times, error percentage, throughput, and more, all of which help identify bottlenecks in application performance. Understanding the Statistics Report is crucial as it provides valuable insights into application behavior under different load conditions; thus, it aids in determining scalability, reliability, and capacity planning. It forms the basis to uncover potential performance issues, optimize system performance, and ensure a seamless user experience.

JMeter Statistics in Dashboard Report

Detailed Analysis of the Aggregate Report

The detailed analysis of the Aggregate Report in JMeter involves examining various columns that provide information about the performance of the application. Key metrics include:

  • Label Name: name of a sampler.
  • Number of Samples: the total number of requests made.
  • Average, Min, Max, Median, 90th, 95th and 95th percentile: These indicate the various response times, respectively, providing a clear perspective on overall application performance.
  • Throughput: Number of requests per unit of time that your application can handle.
  • Number of failed requests and Error %: This presents the total number of failed requests and their rate as compared to the total requests, signaling issues if the value is high.
  • Network - Received and Sent: The amount of data being transferred in both directions, represented as KB/sec.

Each of these columns in the Statistics Report furnishes a different piece of the performance puzzle. They collectively give us a well-rounded view of the system's performance under assorted load conditions. Detailed analysis of these metrics helps to detect weak attributes and areas that need further improvement to ensure an optimized and seamless user experience. This analysis also helps us establish a foundational understanding of the system requirements, guiding strategic improvement plans and facilitating better performance.

Interpreting the Results From the Statistics Report

Interpreting results from the JMeter Statistics Report involves deciphering data from each column to gain insights into application performance. For instance, prolonged response times indicates potential performance hiccups, while variations in Min and Max response times could imply inconsistent performance. A high Error % could be a red flag reflecting issues with server capacity or backend programming. Low throughput value together with long response times, most likely means a bottleneck in the application or infrastructure. By correctly reading and interpreting this data, you can identify potential problem areas, such as system stress points, bottlenecks, or areas of inefficiency. These insights provide a useful foundation for defining corrective measures and performance optimization strategies.

It helps you develop a forward-looking perspective and create an action plan to enhance your performance strategy, ensuring a robust and seamless user experience.

Limitations of the Statistics Report

While the Statistics Report in JMeter Dashboard is indispensably beneficial, it possesses limitations. Primarily, it cannot display the values over time, for this, we need to have a look at the included graphs. For instance, the throughput could seem acceptable but by looking at the graph we could spot some drops in the performance that would be worth further investigation. This applies to most of the provided metrics - we need to have a look at the graphs to spot the patterns of potential performance hiccups. The Statistics table misses for instance a standard deviation, a measure of how much the data deviates from the mean or average value. It provides valuable insights into the consistency and reliability of a given metric. Another drawback is that finding the respective graph for a given label requires you to go to another tab and find the correct label among the others. Last, but not least, it's not very easy to compare those metrics with another report, for instance, you want to assess the new changes in your application and compare it with the state before those changes. That's where JtlReport could be handy. It addresses all the above-mentioned issues: easy test report comparison, configurable request statistics including the standard deviation, graphs integrated into request statistics table and much more.

· 5 min read

JMeter, also known as Apache JMeter, is a powerful open-source software that you can use to perform load testing, functional testing, and performance measurements on your application or website. It helps you understand how your application behaves under different levels of load and can reveal bottlenecks or issues in your system that could impact user experience.  This article will guide you on how to generate a JMeter Dashboard Report, ensuring that you utilize this critical tool productively and effectively for your application performance optimization.

Software Requirements

To generate a JMeter Dashboard Report, certain software prerequisites must be met. Firstly, Apache JMeter, the load-testing tool, should be installed on your system, with the latest stable release preferred. Secondly, given JMeter's Java base, you'll also need to install the Java Development Kit (JDK), preferably the latest version. Don't forget to set your JAVA_HOME environment variable to your JDK installation path. Lastly, depending on your testing needs, additional plugins or applications may be necessary for data analysis or software integration with JMeter.

Detailed Step-by-step Guide on How to Generate JMeter Dashboard Report

Setting up the Environment

First, confirm that JMeter and JDK are installed correctly. You can do this by opening a command prompt (or terminal in Linux/Mac) and typing jmeter -v and java -version. These commands should return the JMeter and JDK versions installed on your PC, respectively. Next, open JMeter application. Choose your preferred location to store the output. It should be a place where JMeter can generate results and graphs. Set up your test plan. A test plan specifies what to test and how to run the test. You can add a thread group to the test plan and configure the number of users, ramp-up period, and loop count, among other parameters.

Planning and Executing the Test

Add the necessary samplers to the thread group. Samplers tell JMeter to send requests to a server and wait for a response.  Now add listeners to your test plan. Listeners provide access to the data gathered by JMeter about the test cases as a sampler component of JMeter is executed. Execute your test plan. You can run your test by clicking the "Start" button (green triangle) on the JMeter tool's top bar.

Generating the Report

To create your Dashboard Report from the JTL file, go to the command line, navigate to your JMeter bin directory, and use the following command:

jmeter -g [path to JTL file] -o [folder where dashboard should be generated].

After running this command, JMeter generates a Dashboard Report in the specified output folder. This report includes various charts and tables that present a visual analysis of your performance test.

jmeter report summary

Understanding JMeter Dashboard Report

  1. Top Level (Summary): This section provides an overview of the test, including test duration, total requests, errors, throughput (requests per second), average response time, and more. 
  2. APDEX (Application Performance Index): This index measures user satisfaction based on the response times of your application.
  3. Graphical representation of Results: JMeter includes various charts such as throughput-over-time, response-time-over-time, active-threads-over-time, etc. Each of these graphs provides a visual representation of your test's metrics over different time spans.
  4. Request Summary: This table provides more detailed information for each sampler/request, such as median, min/max response times, error percentages, etc. jmeter report statistics

Key Metrics in the Report

Some of the essential metrics you will come across in a JMeter Dashboard report include:

  1. Error %: The percentage of requests with errors.
  2. Throughput: Number of requests per unit of time that your application can handle.
  3. Min / Max time: The least / maximum time taken to handle the requests.
  4. 90 % line: 90 percent of the response times are below this value.

Interpreting the Report

Interpreting the Dashboard Report involves looking at these metrics and evaluating whether they meet your application's performance requirements.

  1. The Error % should ideally be zero. Any non-zero value indicates problems in the tested application or the testing setup.
  2. High throughput with low response time indicates good performance. However, if response time increases with throughput, it might signal performance issues.
  3. The 90% line is often taken as the 'acceptable' response time. If most of the response times (90%) are within this limit, the performance is generally considered satisfactory.
  4. The APDEX score, ranging from 0 to 1, should ideally be close to 1. A value less than 0.7 indicates that the performance needs improvement. By understanding these key points, you can interpret JMeter Dashboard Report effectively, enabling you to draw conclusions about your application's performance and plan improvements accordingly.

Conclusion

The JMeter Dashboard Report is a powerful tool that provides insights into the performance of your website or application. This extensive and visual report allows you to ascertain the performance bottlenecks and potential room for optimization, thereby enabling you to enhance the end-user experience.

Alternatively, you can get performance testing reports with JtlReporter. With JtlReporter, you can quickly and easily create comprehensive and easy to understand performance test reports for your system with metrics, such as requests per second, various percentiles, error rate, and much more. Additionally, you can compare test runs side-by-side, create custom charts with any metrics available, and set up notifications for external services to be informed when a report is processed and more.

Try JtlReporter today and get detailed performance test reports with ease!

· 4 min read

In performance testing, it is integral to have detailed, accurate methods for trending and variability analysis. A useful visual tool that helps in this regard is the histogram. Using histograms in performance testing reports can aid in the breakdown of data distribution, revealing the shape and spreading of performance test data, thus enhancing understanding of test results.

Relationship Between Histograms and Standard Deviation in Performance Testing

A histogram complements other measures of data distribution, such as standard deviation. While standard deviation elucidates the degree of data dispersion from the mean, histograms visually portray data grouping in intervals, clearly highlighting the frequency of data occurring within these intervals. The marriage of histograms and standard deviation can lead to a more comprehensive understanding of data distribution.

The histogram uses its visual prowess to depict and highlight the position and range of all data points grouped into bins, while standard deviation uses its mathematical sharpness to assess the dispersion and deviation of the data. Collaboratively, they provide us nuanced way for understanding of the distribution of collected data samples.

Understanding Normal Distribution in Histograms

A critical concept represented by histograms in performance testing is normal distribution, which often emerges as a likely outcome. Normal distribution, depicted as a bell curve, signifies that most data points cluster near the mean, with the frequency gradually declining as they diverge from the center. This renders the normal distribution pattern symmetric.

In performance testing, such normal distribution might indicate a stable system where the majority of response times congregate around a central value. Observing an abnormally shaped histogram or one with significant skewness, conversely, may reveal system performance issues.

Hence, understanding normal distribution in the performance testing context is an essential skill for testers. It is a visual cue in the histogram that carries great weight. Moreover, it aids in forming informed expectations about system behavior. So, as testers, our eye on the histogram should always look out for the bell curve of normal distribution.

Utility and Relevance of Histograms in Performance Testing Reports

Given their ability to elucidate data patterns visually, histograms hold high utility in performance tests reports. They furnish testers with an easy-to-understand, intuitive breakdown of data distribution over a range of response times.

With bins on the horizontal axis representing data ranges and bars on the vertical axis signifying the frequency of data within these ranges, histograms aptly illustrate the concentration and dispersion of response times. Consequently, they yield important insights into system response behavior under different workloads.

Additionally, reviewing histograms over sequential test runs can help identify trends, and brief or sustained changes, aiding system fine-tuning and optimization.

The profound relevance of histograms encompasses providing insights into extreme values too. A sudden tall peak in a histogram could indicate an outlier identify, data points that deviate significantly from the mean, that needs to be investigated and analyzed to ensure the robustness and reliability of a system. Another example would be a histogram that is heavily skewed or has multiple peaks, for instance, may signify issues with system balance or the existence of multiple user groups with different behavior. A narrow histogram indicates a potentially healthier system with consistent response times. On the other hand, a broad, flat histogram may point toward a system with unpredictable response times, highlighting areas that need improvement for better performance consistency.

Histogram with outlier data

With the ability to illuminate the grey areas of data distribution, spotlight outliers, and, above all, present complicated data in an accessible, user-friendly format, histograms hold high relevance in the world of performance testing reports.

Closing Thoughts

In sum, histograms play a pivotal role in the domain of performance test reports. As a visualization tool, they work in tandem with measures like standard deviation to offer a comprehensive perspective on data distribution. By illustrating patterns such as normal distribution and highlighting outliers, they significantly assist in performance testing analytics and deepen the understanding of test results.

Histogram chart is available in JtlReporter for every label, so you can analyze every sampler individually, and it gives you also the ability to compare histograms of two different performance testing reports. Get started with JtlReporter today!

· 3 min read

Performance testing is an important aspect of software development, as it helps ensure that a system or application can handle the expected workload and user traffic. A performance testing report is a document that outlines the results of a performance test and provides insights on the system's performance under various conditions.

Report

There are various types of performance tests, including load testing, stress testing, and endurance testing. Load testing involves simulating a normal workload on the system to ensure it can handle the expected traffic. Stress testing involves increasing the workload beyond normal levels to see how the system performs under increased demand. Endurance testing involves running the system at a high workload for an extended period of time to ensure it can sustain that level of performance.

A performance testing report should include a summary of the test objectives, the testing environment, and the test results. It should also include any issues or bottlenecks that were identified during the testing process and provide recommendations for improvement.

One key aspect of a performance testing report is the use of performance metrics. These metrics can help identify areas of the system that may need improvement and provide a baseline for future performance testing. Common performance metrics include response time (90, 95 and 99 percentiles, average, min and max), throughput, error rate, connection time, networks stats. All of these metrics are provided in JtlReporter. The more, you can adjust the displayed metrics as wanted - by default the application shows all the metrics in the table, but if you feel it's too overwhelming you can easily limit it.

Request stats

Another important aspect of a performance testing report is the presentation of the results. The report should include graphs and charts to clearly show the test results and make it easy for readers to understand the findings. JtlReport renders all basic graphs for overall performance, but also for individual labels and its various metrics. But it does not stop here. It even adds a possibility to display a trends for individual labels - you will get a history timeline of a performance per label.

Label trend

But it also gives you the possibility to create custom charts where you can combine all the available metrics as wanted to find the desired correlation. This custom chart is saved per user session and loaded when report is opened.

Performance testing report is a valuable document that provides insights on the performance of a system or application under various conditions. It can help identify issues and bottlenecks, provide recommendations for improvement, and serve as a baseline for future performance testing.

Do you want to get more from your JMeter or Locust.io performance test? Get started with JtlReporter.