
5 posts tagged with "Locust.io"

View All Tags

· 6 min read

Locust.io is a highly effective open-source performance testing tool designed to help developers ascertain how their systems will function under the stress of multiple users. By simulating simultaneous users, locust.io provides comprehensive insights into system performance and potential points of failure. It's Python-based and allows developers to write test scenarios in the form of Python scripts. This offers a significant degree of flexibility when it comes to generating specific user behaviors. The software is easy to use and offers efficient load-testing capabilities, including an informative HTML report feature. This article delves into how to generate and understand these HTML reports to make the most of locust.io for optimum system performance.

Locust.io HTML Report

Procedure to Generate HTML Report Using Locust.io

Creating an HTML report in locust.io is a relatively straightforward process that delivers insights into your system's performance. Follow these steps to create your own HTML report:

The article assumes locust.io is installed on your machine, and you have an existing locust script.

  1. After writing test cases, run locust using the command line. Use the following command: locust -f locustfile.py --html=report.html. Replace "locustfile.py" with your file's name, and "report.html" should represent the name of your output file.
  2. Open the locust interface, typically running at http://localhost:8089. Set the number of total users to simulate and spawn rate, then start swarming to initiate the test.
  3. Once you have finished the test case, an HTML report will be automatically generated.

Generating these regular reports is vital for assessing performance over time, which allows developers to catch potential problems early and avoid system breakdown due to high loads. It aids in monitoring system behavior under various load patterns, aiding in detecting bottlenecks, capacity constraints, and possibilities for optimization. By comprehending these reports, one can better maintain system stability and ensure an excellent user experience.

Understanding the Report

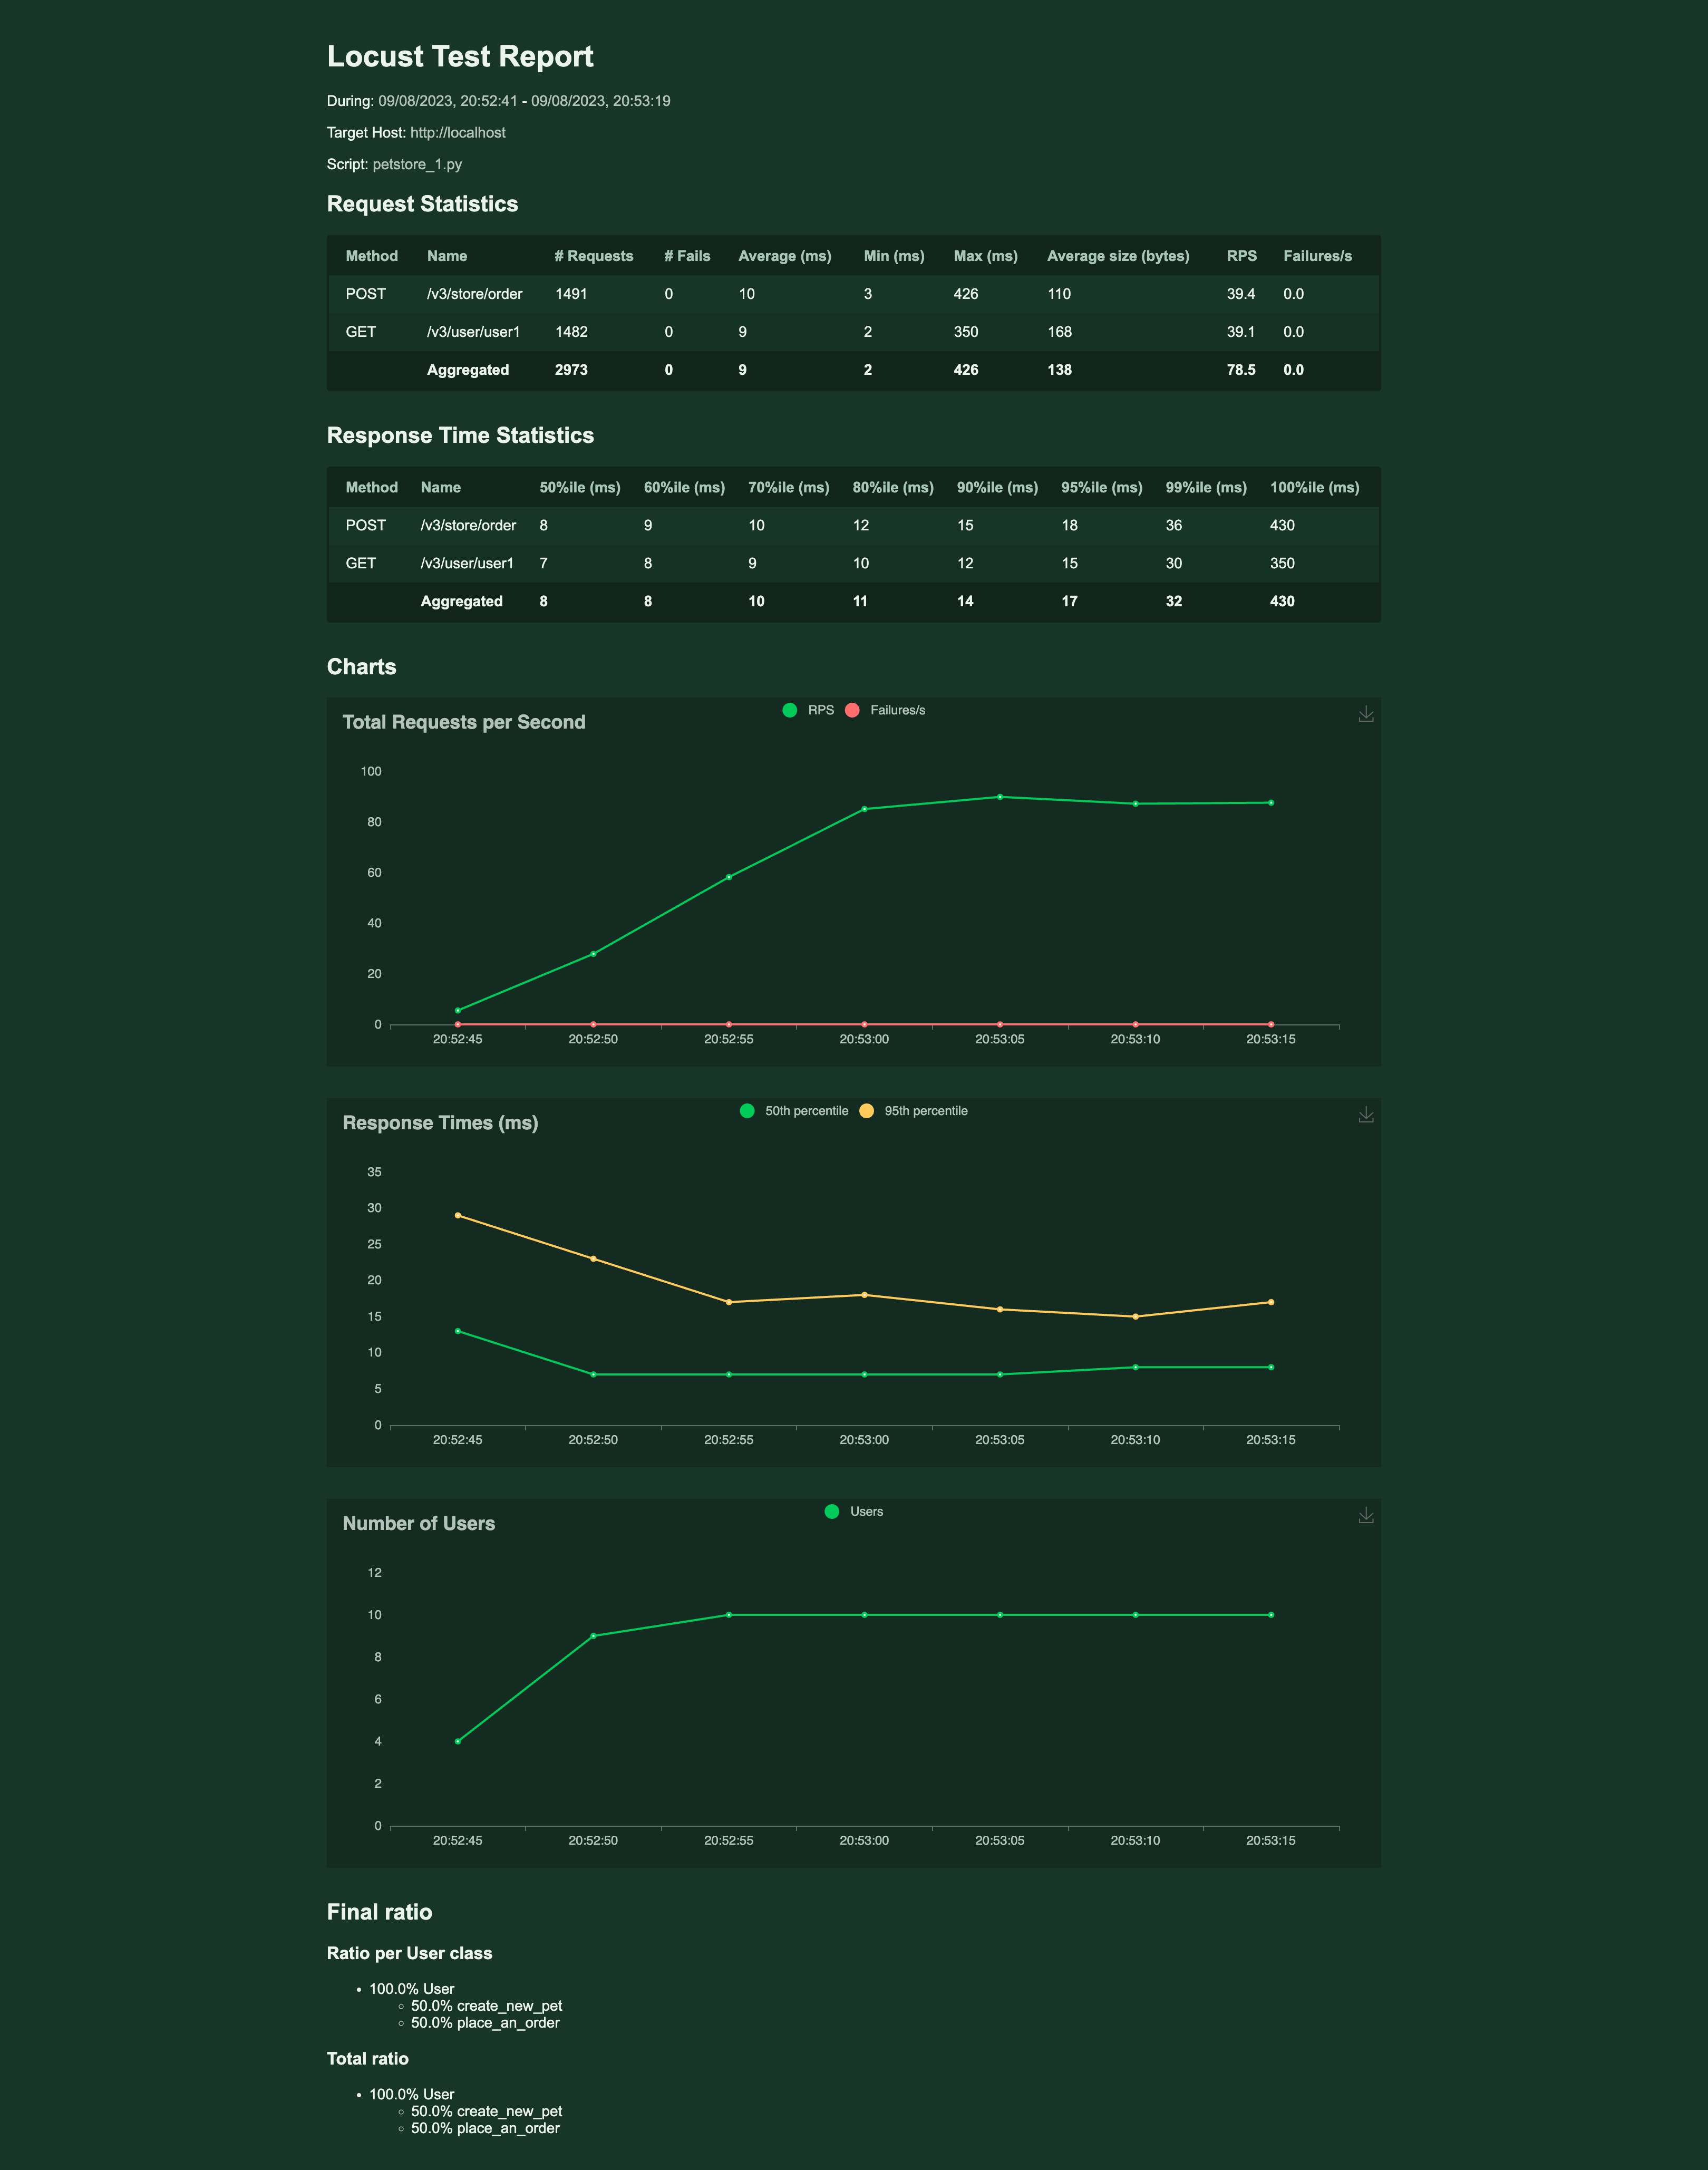
Understanding locust.io's HTML report is crucial to extract useful insights about your system's performance. Testing with locust.io results in an HTML report with several data fields and sections. Here's how to interpret the key sections.

Statistic Table

The report opens with a statistic table that includes the number of requests made, their distribution, and frequency. Three key parameters here are:

  • Requests/sec: This is the number of completed requests per second.
  • Fails: This includes the counts and the percentage of failures.
  • Failures/sec: This is the number of failed requests per second
  • Median & Average Response Time: These figures indicate how long it took to process the requests, with the median being the middle value in the time set. But please note, that average is not the best metric to follow, actually they might be a misleading metric.

Distribution Stats

This table shows the distribution of response times, which is vital to understand the user experience at different percentiles of the load. The most often considered percentiles are p50(median), p90, p95 and p99. If the concept of percentile is new to you, please check Performance Testing Metric - Percentile, as this is metric is crucial in performance testing.

Charts

In the end, there are three different charts displaying the number of users, Response times, and Requests per second. These charts provide a visual reference for the system's performance over time. As you can see those are aggregated charts from all request, you cannot see there charts for individual requests.

These data points collectively provide a basic view of how the system performed under the simulated load. Those charts can provide some insights into application performance overtime, but won't reveal subtle nuances - such as performance drops in individual requests. Those drops can be easily hidden in the aggregated charts.

Key Metrics Measured by Locust.io

Key metrics are fundamental to assessing how well your system performed under testing. Some of the crucial metrics measured by locust.io include the following.

  • Response Time: This is the time taken by a system to respond to a user request. It is provided in locust.io's report in various forms - percentiles, average, min and max response time. Lower response times generally indicate better performance. Unfortunately, Locust.io does not provide us with standard deviation, which is helpful in system performance stability assessment. Instead, you could have a look at the difference between min response time and average. If the there is a big difference between them, it might indicate a performance bottleneck.
  • Error Rate: Represented as 'Fail' in the report, this measures the number and percentage of failed requests in relation to total requests made. In an ideal situation, the error rate should be zero; however, when performing intense load-testing, it's common to see some errors which can help identify potential weak points or bugs in the system.
  • Requests Per Second: This denotes the number of requests a system can handle per second. A higher number indicates better system performance. It plays a crucial role in determining if your system can handle high traffic while still providing decent response times. Please refer to our other article if you would like to know the difference between the number of virtual users and RPS.

These metrics, in conjunction with others provided in locust.io's HTML report, provide a basic overview of your system's performance under load. By regularly monitoring these metrics, developers can ensure their systems are always ready to handle actual user traffic.

Decoding Performance Metrics with Locust.io & Glimpsing Beyond with Jtl Reporter

In conclusion, locust.io provides a robust and reasonably detailed approach to performance testing with its capacity to simulate thousands of users and generate insightful HTML reports. Its easy-to-understand report format allows developers to interpret key metrics such as response time, error rate, and requests per second effectively. Regular report generation is also vital to continually improve system performance and catch potential problems early.

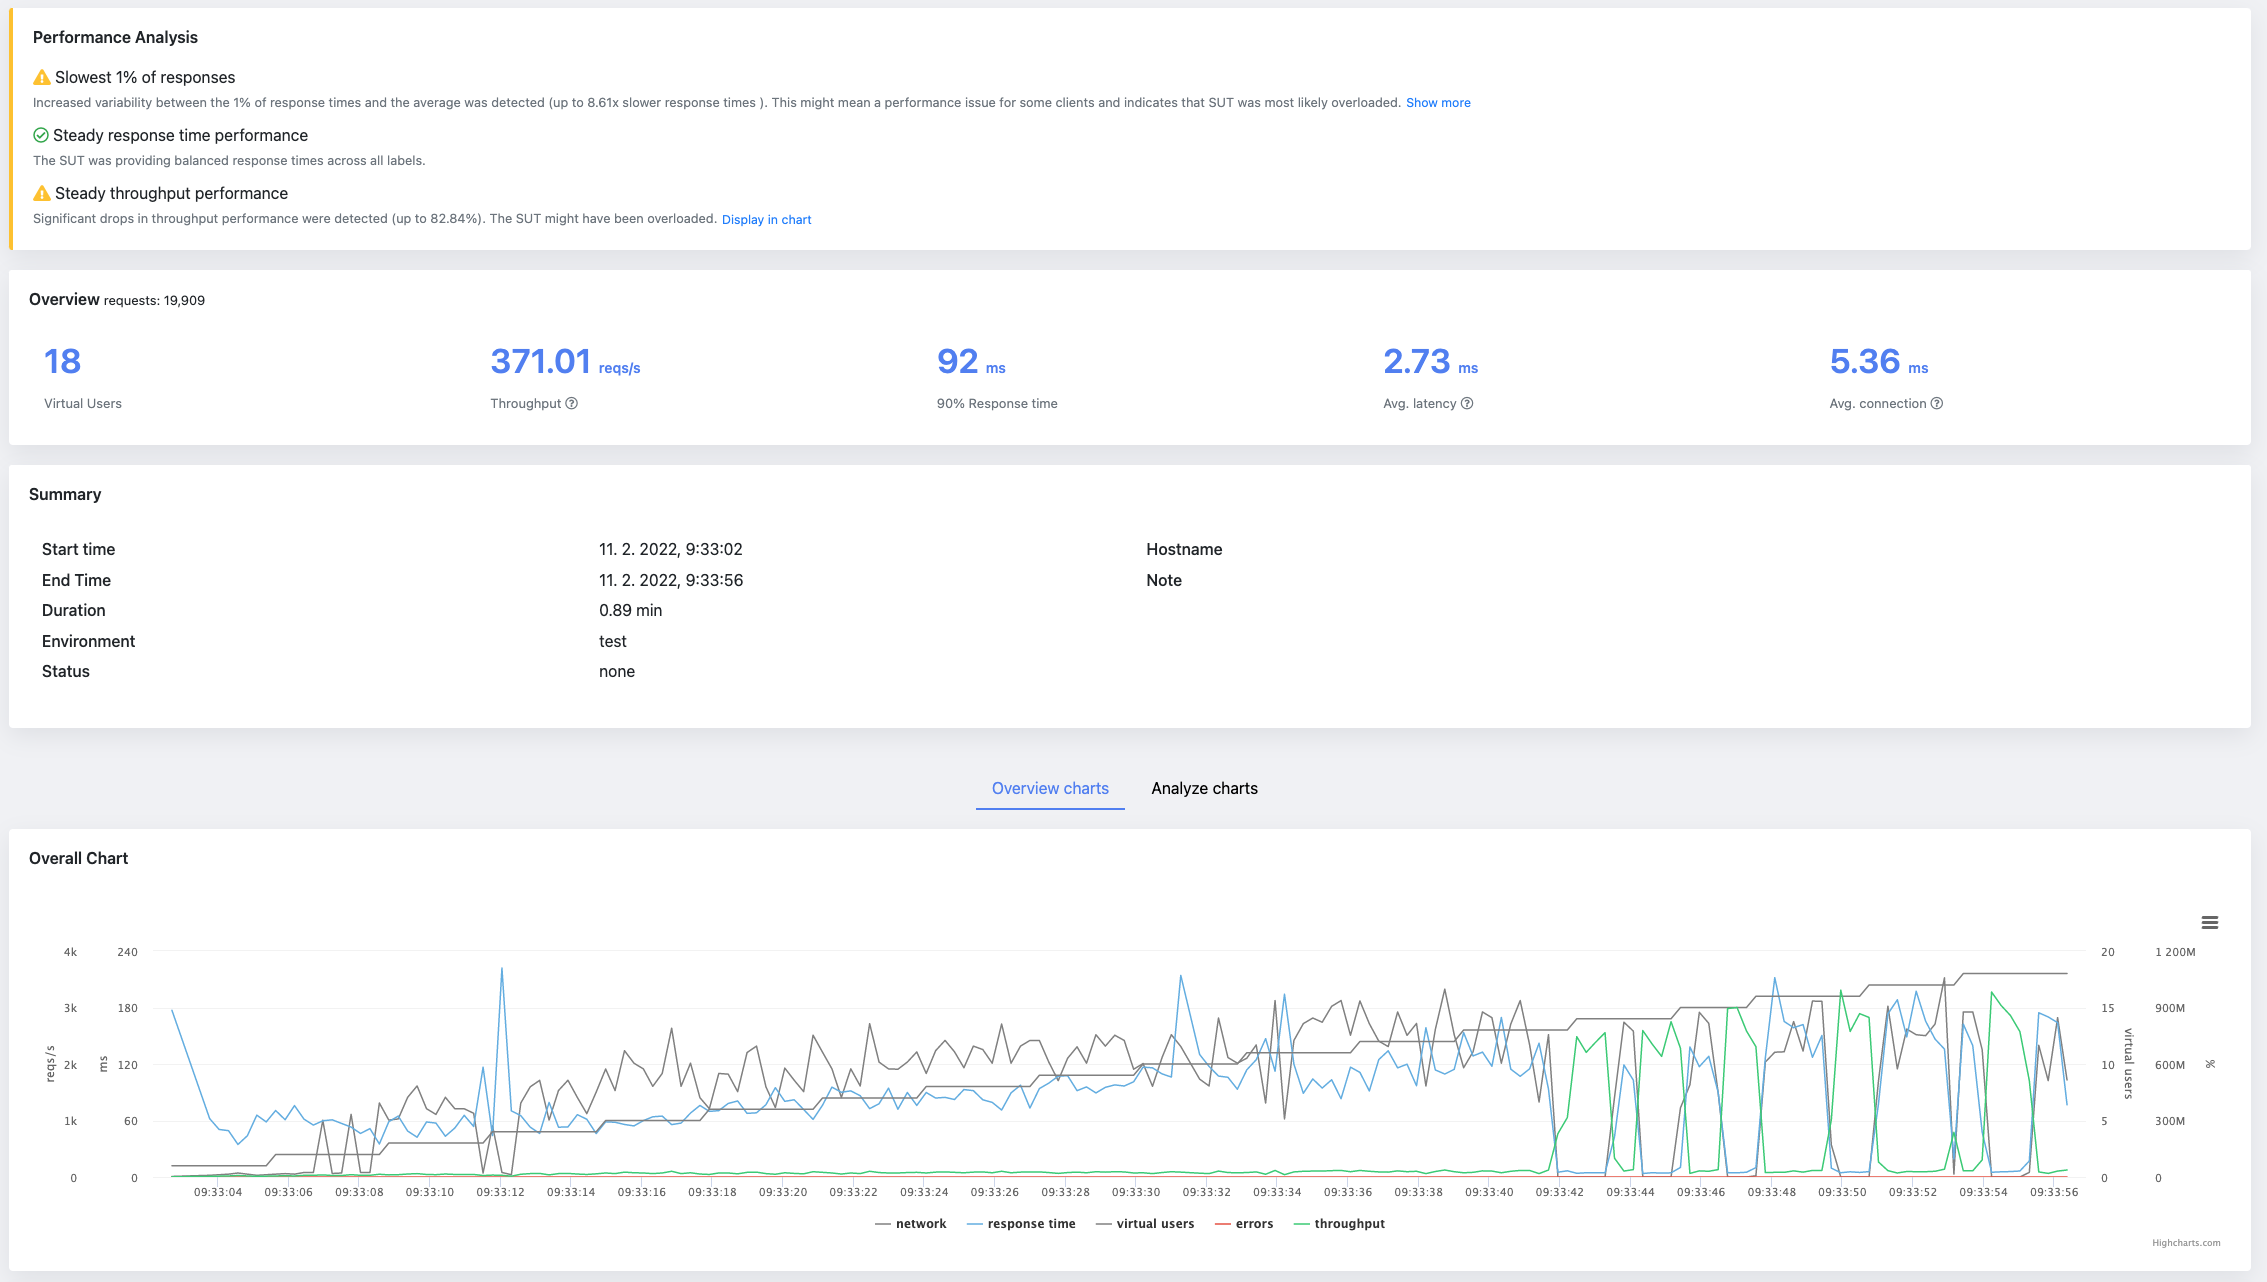
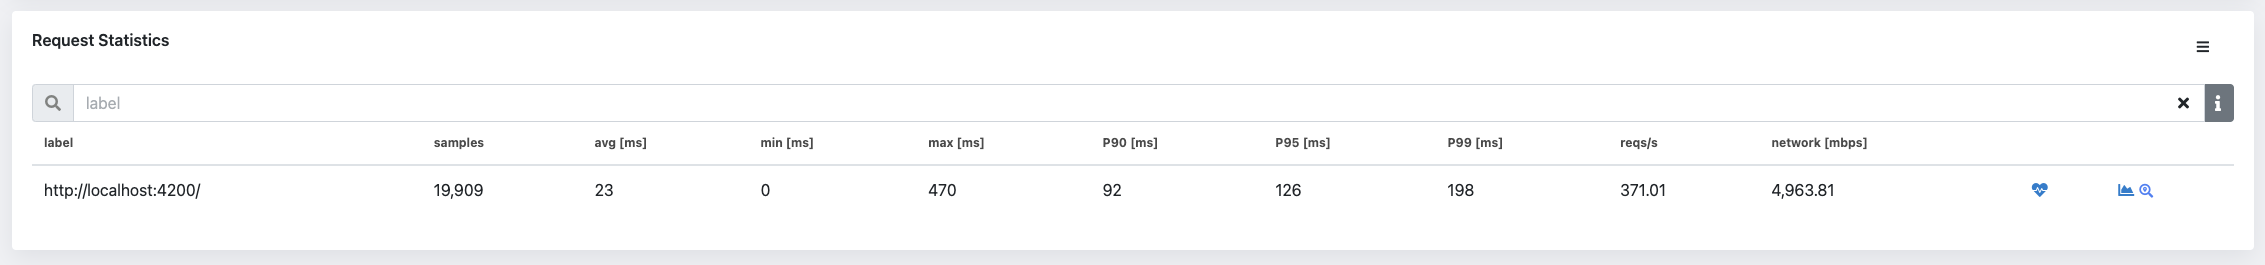
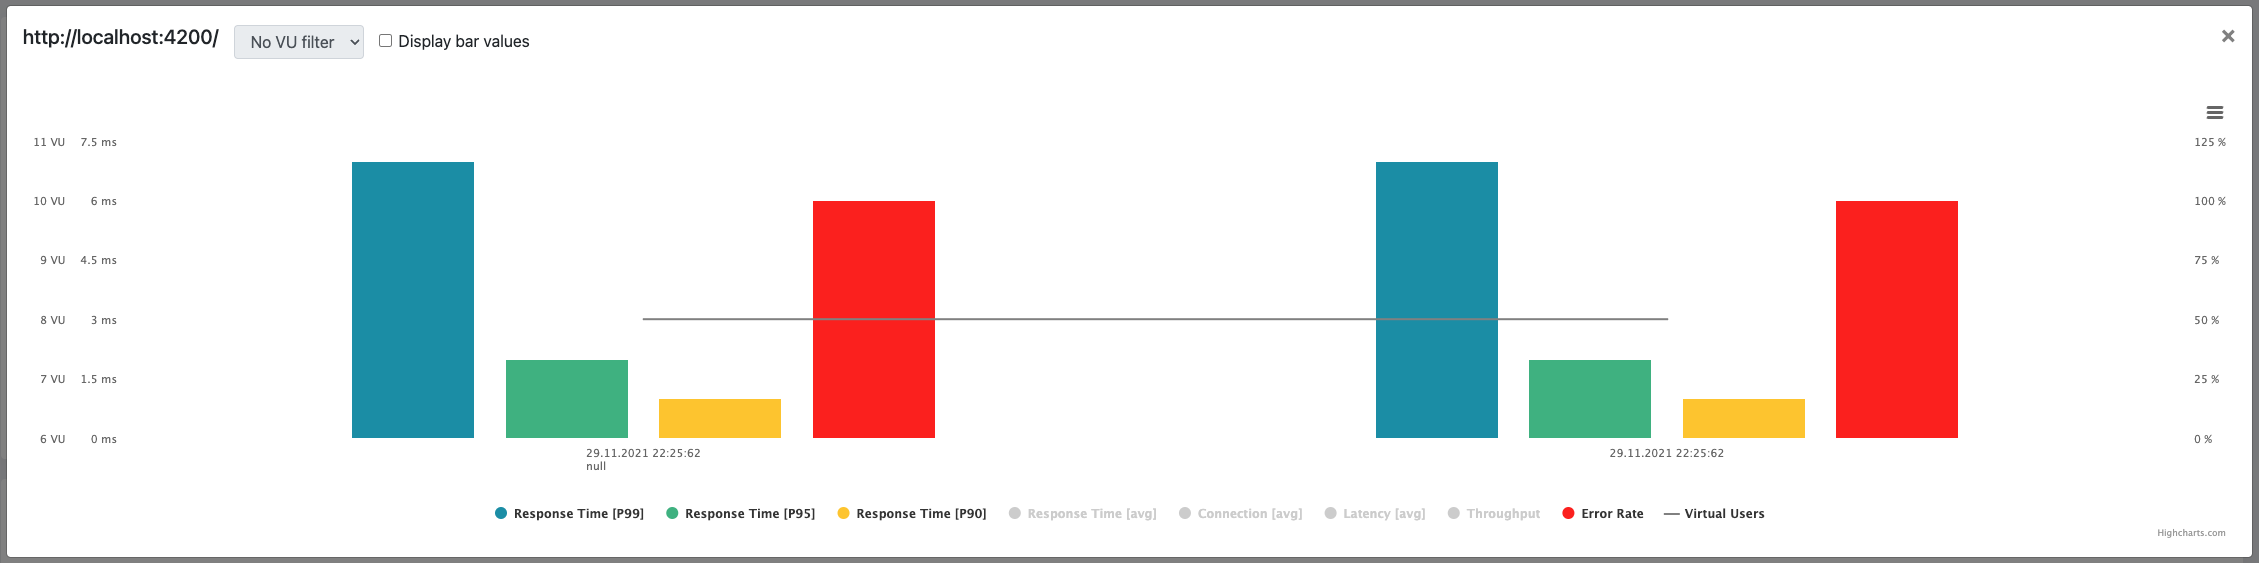
However, while locust.io's HTML offers neat features, alternatives like JtlReporter offer more flexibility and features. JtlReporter can provide rich analytic features, supportive visual charts, and even storage options for test results. Its user-friendly interface and detailed analysis can provide a comprehensive overview of system performance, which can be a perfect fit for highly complex large-scale systems. Therefore, while utilizing locust.io for performance testing, give a JtlReporter a try.

· 5 min read

Load testing is an important part of software development, as it helps determine an application's performance, scalability, and reliability under normal and expected user loads. Locust is an open-source load testing tool that allows developers to quickly and easily create application performance tests.

Why Use Locust.io?

Locust.io is an excellent choice for load testing because it is easy to set up and use. It is also very flexible, allowing you to write your own custom test scripts. Furthermore, it can be run distributed across multiple machines, allowing you to simulate many user traffic and requests.

The main advantages of Locust are its scalability, flexibility, and ease of use. It is designed to be easy to learn and use, so developers can get up and running quickly. It also provides the ability to scale up the number of users and requests quickly and easily, making it an excellent choice for performance testing.

You'll need to install it on your system so you'll be able to start with Locust. Locust is available for all major operating systems, including Windows, Mac OS X, and Linux. Once installed, you can use the Locust command line interface to create a test simulation. This is where you will define the number of users and requests you want to simulate. You can also configure each user's behavior, such as the time between each request and the duration of each request.

Example

For this example, we will use a simple FastAPI application and a Locust test script to simulate user traffic and requests.

FastAPI App

First, we will create a FastAPI application to serve as the system under test.

import uvicorn
from fastapi import FastAPI, Body

app = FastAPI()

@app.get('/')
def root():
return {'message': 'Hello, world!'}

@app.post('/user')
def create_user(username: str = Body(...)):
return {'message': f'User {username} created!'}

if __name__ == '__main__':
uvicorn.run(app)


Locust Test Script

Now, we will create a Locust test script to simulate user traffic and requests to the FastAPI application.

from locust import HttpUser, TaskSet, task

class MyUser(HttpUser):
@task
def index(self):
self.client.get('/')

@task
def create_user(self):
self.client.post('/user', data={'username': 'test_user'})

This test script will simulate a single user making a request to the root URL of the FastAPI application and creating a user.

Test Script Execution

You execute the test script by the following command: locust -f <test_script.py>

Locust will bring up a user interface available at: http://localhost:8089. From there you can execute the test script. But before the actual execution, you need to enter the number of users you want to simulate and the spawn rate. Spawn rate means how many users will be started per second. And last but not least, you will need to enter a host.

If everything was set up correctly, you just executed your first load test with Locust.io! Awesome!

Alright, this was a very basic execution which won't be most likely enough for a real word load testing scenario. To get there we will need to generate a bigger load. And for this reason, we'll need to run locust in distributed mode.

Running Locust Distributed

Locust can also be run and distributed across one or multiple machines. This allows you to simulate a larger amount of user traffic and requests.

Locust's architecture consists of two nodes - the master and worker nodes. The master node collects statistics from the worker nodes and presents them in the web UI. The worker nodes are responsible for generating user traffic and requests.

To run the same test in the distributed mode we would use the following commands:

locust -f <test_script.py> --master

locust -f <test_script.py> --worker --master-host=localhost

The first command starts the locust master node, while the other connects the worker node to it. It's recommended to run one worker node per CPU core at max to avoid any issues. Of course, the worker nodes can be started from different machines, but be aware the test script must be available at all the machines.

For convenience, Locust can also be run in a Docker container. This allows you to spin up a distributed load test environment quickly, either using docker-compose or k8s.

Reporting

CSV

Retrieving Test Statistics in CSV Format Once the test is complete, you can retrieve the test statistics in CSV format by running the following command:

locust -f <test_script.py> --csv <output_file_name>

Once the test simulation is configured, you can start running the test. Locust will then run the test simulation and provide results about the application's performance. This includes metrics like average response time, requests per second, and error rates.

HTML Report

The HTML report can be downloaded from the locust UI during or after the test script execution. It can provide basic charts and request stats, that include metrics like requests per second, error rates, and various percentiles for response times. You can also use the results to identify bottlenecks in your application and make changes to improve performance.

Conclusion

Overall, Locust is an excellent choice for performance testing. It is easy to install and use and provides detailed performance metrics and debugging capabilities. It is also highly scalable to test applications with many users and requests.

Are you looking for an easy way to measure the performance of your application and create detailed performance test reports? Look no further than JtlReporter!

With JtlReporter, you can quickly and easily create comprehensive performance test reports for your system with metrics, such as requests per second, various percentiles, error rate, and much more. Additionally, you can compare test runs side-by-side, create custom charts with any metrics available, and set up notifications for external services to be informed when a report is processed.

JtlReporter is the perfect way to measure and analyze performance when load testing your application using Locust.io. Try JtlReporter today and get detailed performance test reports with ease!

· 4 min read

As technology continues to advance, organizations are becoming increasingly reliant on computer systems to support their operations. To ensure that these systems are performing optimally, it is essential to measure their performance. A good performance test report will contain many metrics, but they can be a bit difficult to understand for non-professional performance testers. That’s when the APDEX (Application Performance Index) metric can become very useful as it is a simple and easy-to-understand metric that helps organizations understand how well their systems are performing and identify areas for improvement. In this blog post, we will explore what the APDEX metric is, how it works, and its advantages and disadvantages.

What is the APDEX Metric?

The APDEX metric is a standardized way of measuring the performance of computer systems. It is based on the response time of a system, which is the amount of time it takes for a system to respond to a user request. The APDEX metric is calculated using a formula that takes into account the number of satisfactory, tolerable, and unsatisfactory responses.

How Does it Work?

To calculate the APDEX score, organizations need to set two thresholds for response time. The first threshold is the satisfactory threshold and the second is the tolerable threshold. They are set based on the specific requirements of the system. Once the thresholds are decided, the APDEX formula is applied to the response time data. The APDEX formula is as follows: APDEX = (Satisfied Count + (Tolerated Count/2)) / Total Count

Where:

  • Satisfied Count is the number of responses that fall within the satisfactory threshold
  • Tolerated Count is the number of responses that fall between satisfactory and tolerating thresholds
  • Total Count is the total number of responses

The resulting score ranges from 0 to 1, with 1 being the best possible score. Based on the APDEX score the application’s performance is assessed:

  • Excellent, 1-0.94
  • Good, 0.93-0.85
  • Fair, 0.84-0.70
  • Poor, 0.69-0.50
  • Unacceptable, below 0.50

Advantages of the APDEX Metric

The APDEX metric has several advantages that make it a popular choice for application performance measurement. Some of these advantages include: Simplicity: The APDEX metric is easy to understand and use, making it accessible to organizations of all sizes and technical abilities. Standardization: The APDEX metric is a standardized tool, which makes it easy to compare the performance of different systems. Flexibility: The threshold for response time can be adjusted to suit the specific requirements of the system, which means that the APDEX metric can be applied to a wide range of systems.

Disadvantages of the APDEX Metric

Despite its popularity, the APDEX metric has also disadvantages that must be taken into account. Some of these disadvantages include: Lack of Variability: The APDEX metric does not account for the variability of performance over time, which means that it may not capture performance issues that occur at specific times or under certain conditions. Limited Scope: The APDEX metric is only based on the response time of a system, which is not the only factor that contributes to the user experience. Factors such as the availability of the system, reliability of the system, and functionality of the system also play a significant role in determining the user experience.

Conclusion

The APDEX metric can be a useful tool for measuring the performance of computer systems. It is easy to use, standardized, and flexible. However, it also has some limitations that must be considered before using it. Organizations should use a combination of metrics to get a more complete picture of system performance.

In recent release of JtlReporter the support for measuring the APDEX score was added. You can get the APDEX score for you JMeter or Locust.io test reports from now on - either get started with JtlReporter or upgrade your instance to the latest version. The metric was made optional and can be turned on in the scenario setting, while both threshold values are adjustable according to your specification and requirements of your system.

· 3 min read

Performance testing metrics are measurements that are used to evaluate the performance of a system or application under a given workload. These metrics help identify any issues or bottlenecks in the system and provide insights on how to improve its performance.

There are various performance testing metrics that can be used, depending on the specific goals and objectives of the test. Some common performance testing metrics include:

  1. Response time: This is the amount of time it takes for a request to be processed and for a response to be returned. A high response time can indicate that the system is overloaded or that there are bottlenecks in the system. For performance analysis it is very useful to use percentiles. The most common percentiles are p90, p95 and p99.
  2. Throughput: This is the number of requests that a system can handle per unit of time. A high throughput is desirable, as it indicates that the system can handle a large volume of traffic.
  3. Error rate: This is the percentage of requests that result in an error. A high error rate can indicate that the system is not functioning properly and needs to be optimized.
  4. Resource utilization: This is the percentage of a system's resources (such as CPU, memory, and network bandwidth) that are being used during the test. High resource utilization can indicate that the system is reaching its limits and may need to be scaled.

It's important to choose the right performance testing metrics for your specific goals and objectives. For example, if you're testing the performance of a web application, you may want to focus on metrics such as response time and error rate. If you're testing the performance of a database, you may want to focus on metrics such as throughput and resource utilization.

Performance testing metrics are an essential part of evaluating the performance of a system or application. By choosing the right metrics and monitoring them during the testing process, you can identify any issues or bottlenecks and make informed decisions on how to improve the system's performance.

JtlReporter can help you to gather all the above-mentioned (and many more!) metrics from your tests created with JMeter, Loucst.io and other performance testing tools. But it does not stop there. JtlReporter gives you the ability to customize the displayed metrics. Not to mention that the metrics are also displayed in comprehensive graphs. You can even easily compare the metrics with your other performance testing runs to find out any changes in performance of your application.

· 3 min read

Performance testing is an important aspect of software development, as it helps ensure that a system or application can handle the expected workload and user traffic. A performance testing report is a document that outlines the results of a performance test and provides insights on the system's performance under various conditions.

Report

There are various types of performance tests, including load testing, stress testing, and endurance testing. Load testing involves simulating a normal workload on the system to ensure it can handle the expected traffic. Stress testing involves increasing the workload beyond normal levels to see how the system performs under increased demand. Endurance testing involves running the system at a high workload for an extended period of time to ensure it can sustain that level of performance.

A performance testing report should include a summary of the test objectives, the testing environment, and the test results. It should also include any issues or bottlenecks that were identified during the testing process and provide recommendations for improvement.

One key aspect of a performance testing report is the use of performance metrics. These metrics can help identify areas of the system that may need improvement and provide a baseline for future performance testing. Common performance metrics include response time (90, 95 and 99 percentiles, average, min and max), throughput, error rate, connection time, networks stats. All of these metrics are provided in JtlReporter. The more, you can adjust the displayed metrics as wanted - by default the application shows all the metrics in the table, but if you feel it's too overwhelming you can easily limit it.

Request stats

Another important aspect of a performance testing report is the presentation of the results. The report should include graphs and charts to clearly show the test results and make it easy for readers to understand the findings. JtlReport renders all basic graphs for overall performance, but also for individual labels and its various metrics. But it does not stop here. It even adds a possibility to display a trends for individual labels - you will get a history timeline of a performance per label.

Label trend

But it also gives you the possibility to create custom charts where you can combine all the available metrics as wanted to find the desired correlation. This custom chart is saved per user session and loaded when report is opened.

Performance testing report is a valuable document that provides insights on the performance of a system or application under various conditions. It can help identify issues and bottlenecks, provide recommendations for improvement, and serve as a baseline for future performance testing.

Do you want to get more from your JMeter or Locust.io performance test? Get started with JtlReporter.